SOLSTICE:
AN ELECTRONIC JOURNAL OF GEOGRAPHY AND MATHEMATICS
SUMMER, 1996
VOLUME VII, NUMBER 1
ANN ARBOR, MICHIGAN
----------------------------------------------------------------------------
Founding Editor-in-Chief:
Sandra Lach Arlinghaus, University of Michigan;
Institute of Mathematical Geography (independent)
Editorial Advisory Board:
Geography.
Michael F. Goodchild, University of California, Santa Barbara
Daniel A. Griffith, Syracuse University
Jonathan D. Mayer, University of Washington (also School of Medicine)
John D. Nystuen, University of Michigan
Mathematics.
William C. Arlinghaus, Lawrence Technological University
Neal Brand, University of North Texas
Kenneth H. Rosen, A. T. & T. Bell Laboratories
Engineering Applications.
William D. Drake, University of Michigan
Education.
Frederick L. Goodman, University of Michigan
Business.
Robert F. Austin, Austin Communications Education Services.
Technical Editor:
Richard Wallace, University of Michigan.
Web Consultant:
William E. Arlinghaus, UMI
WebSite: http://www-personal.umich.edu/~sarhaus/image
Electronic address: sarhaus@umich.edu
------------------------------------------------------------------------------
MISSION STATEMENT
The purpose of Solstice is to promote interaction between geography
and mathematics. Articles in which elements of one discipline are used to
shed light on the other are particularly sought. Also welcome
are original contributions that are purely geographical or purely
mathematical. These may be prefaced (by editor or author) with
commentary suggesting directions that might lead toward the desired
interactions. Individuals wishing to submit articles or other material
should contact an editor, or send e-mail directly to sarhaus@umich.edu.
------------------------------------------------------------------------------
SOLSTICE ARCHIVES
Back issues of Solstice are available on the WebSite of the
Institute of Mathematical Geography,
http://www-personal.umich.edu/~sarhaus/image and on the GOPHER of the
Arizona State University Department of Mathematics. Thanks to Bruce Long
for taking the initiative in this matter. The connections to this GOPHER
are available along a variety of routes through the Internet.
------------------------------------------------------------------------------
PUBLICATION INFORMATION
The electronic files are issued yearly as copyrighted hardcopy in
the Monograph Series of the Institute of Mathematical Geography. This
material will appear in Volume 21 in that series, ISBN to be announced.
To order hardcopy, and to obtain current price lists, write to the
Editor-in-Chief of Solstice at 2790 Briarcliff, Ann Arbor, MI 48105, or
call 313-761-1231.
Suggested form for citation: cite the hardcopy. To cite the
electronic copy, note the exact time of transmission from Ann Arbor, and
cite all the transmission matter as facts of publication. Any copy that
does not superimpose precisely upon the original as transmitted from Ann
Arbor should be presumed to be an altered, bogus copy of Solstice.
------------------------------------------------------------------------------
FORTHCOMING ON THE IMAGE WEBSITE:
Complete Fonseca monograph; keep checking the WebSite
(http://www-personal.umich.edu/~sarhaus/image) in the near future.
------------------------------------------------------------------------------
TABLE OF CONTENTS
1. PHOTO ESSAY
THE GREENING OF DETROIT, 1975-1992: PHYSICAL EFFECTS OF DECLINE
John D. Nystuen, Rhonda Ryznar, Thomas Wagner
2. ALGEBRAIC ASPECTS OF RATIOS
Sandra Lach Arlinghaus
3. EDUCATION GRAPHIC ESSAY
U.S. ROUTE 12 BUFFER
Daniel Jacobs
4. INDEX TO VOLUMES I (1990) TO V (1995).
1. PHOTO ESSAY
THE GREENING OF DETROIT, 1975-1992:
PHYSICAL EFFECTS OF DECLINE
John D. Nystuen, The University of Michigan
Rhonda Ryznar, The University of Michigan
Thomas Wagner, Environmental Research Institute of Michigan
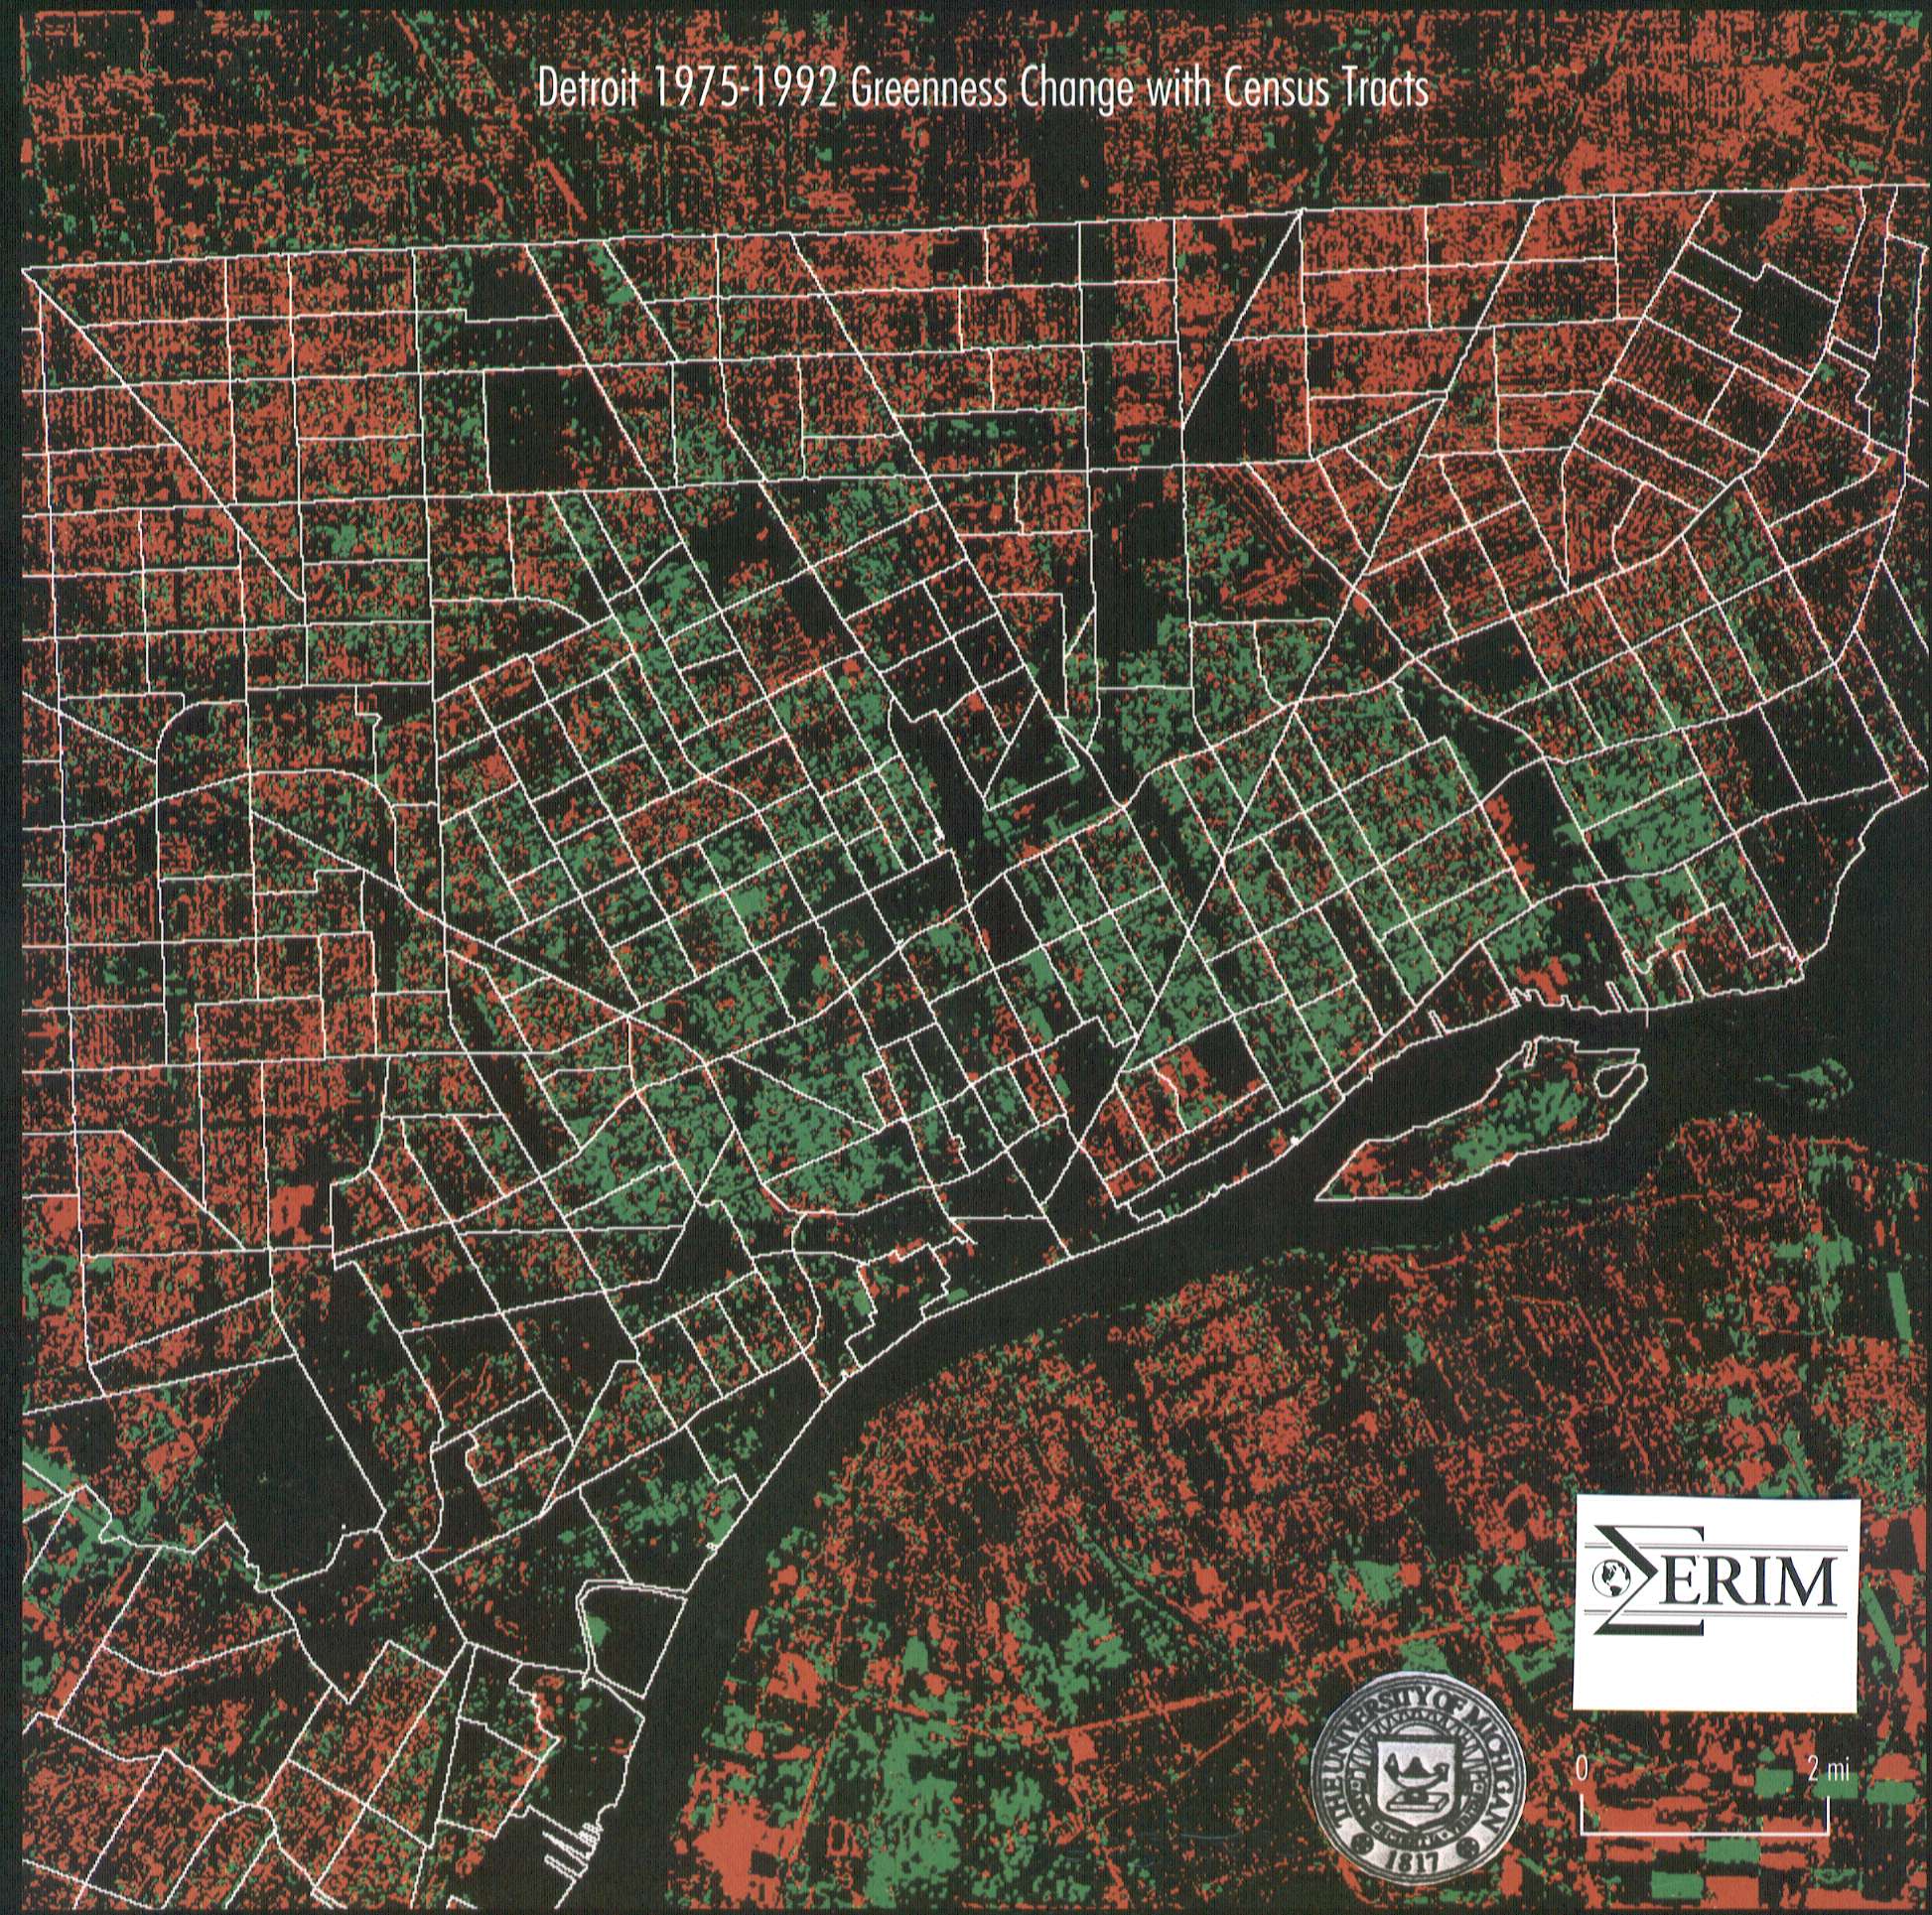
Figure 1. Landsat change image of Detroit showing changes in
urban greenness from 1975 to 1992. Imagery and analysis are joint
ventures between Environmental Research Institute of Michigan (ERIM) and
The University of Michigan, College of Architecture and Urban Planning.
Green areas show tracts with greenness increase; red areas with
greenness decrease; black areas, no change. Change data derived from TM
1992 and MSS 1975 images of vegetation reflectance.
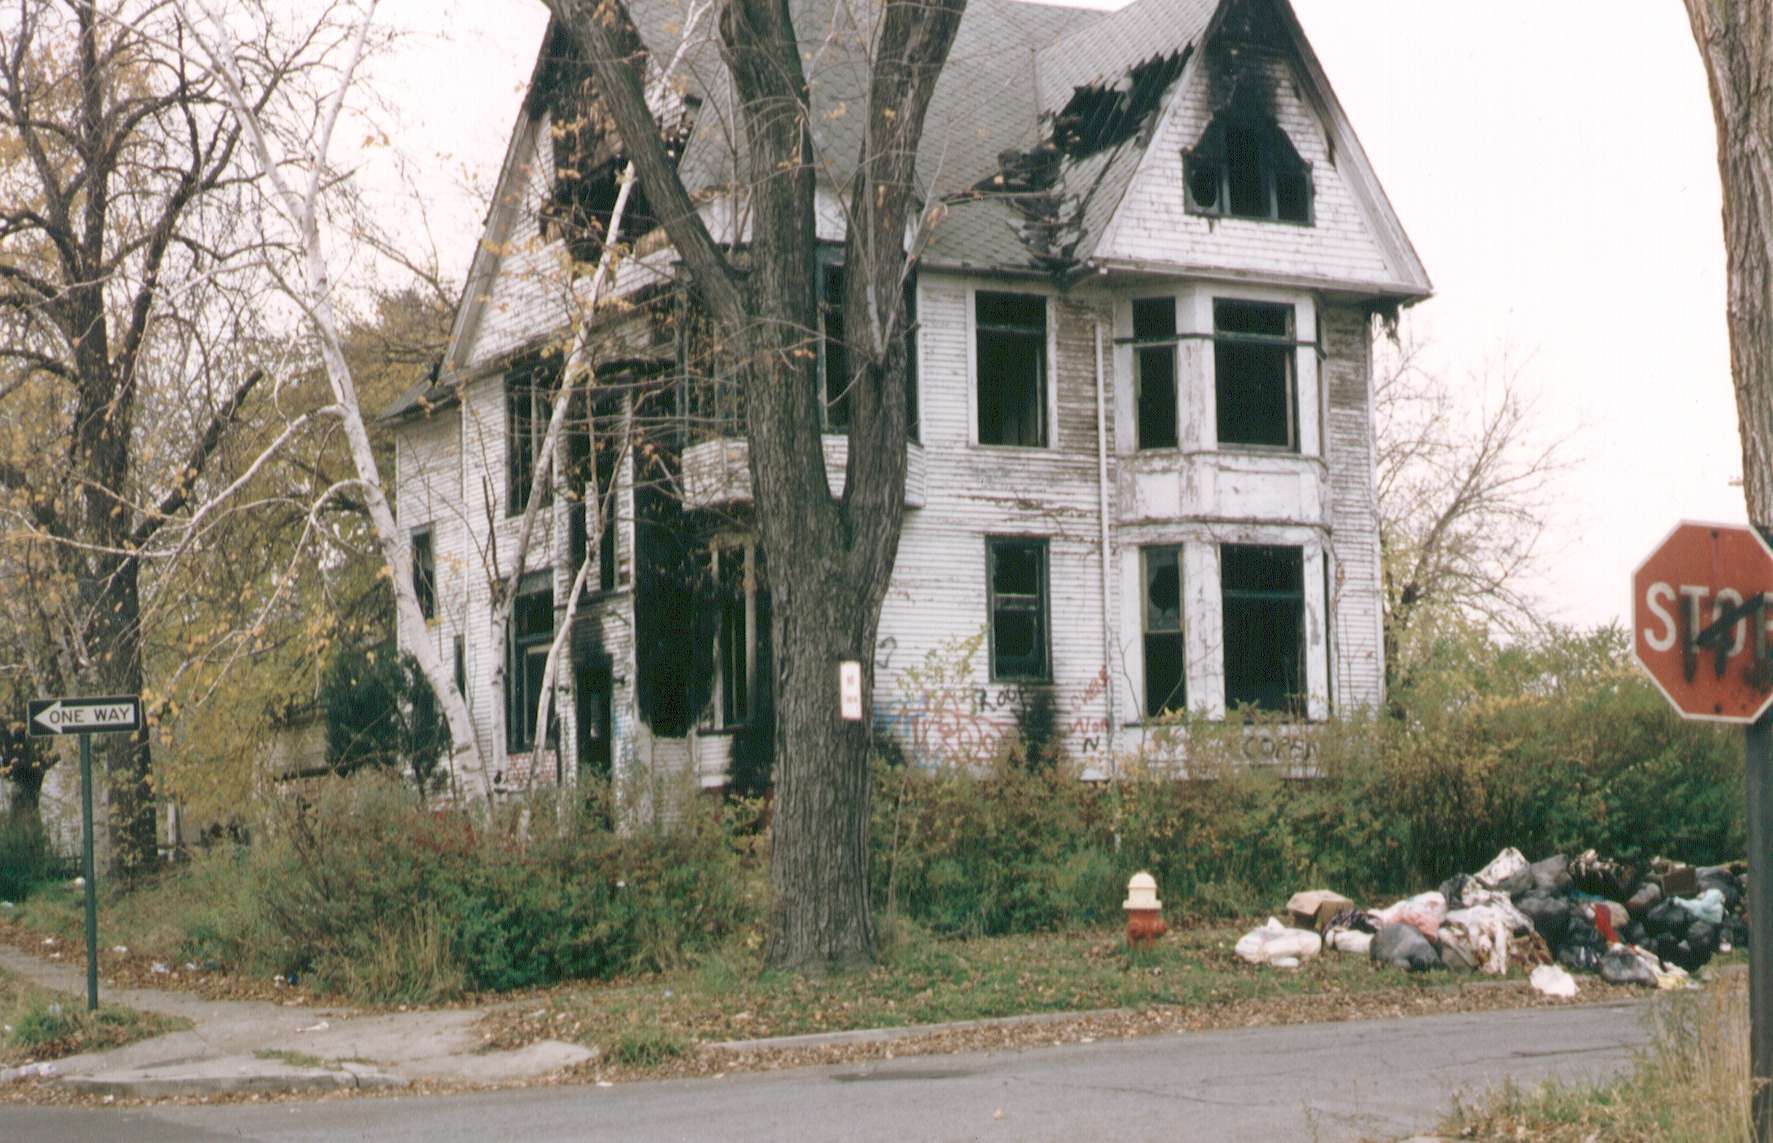
Figure 2. Ground truth, green area (reference to Figure 1).
Areas of increased greenness are places where the social system is
stressed. Houses are abandoned or destroyed. Much of the territory is
vacant land. Sidewalks and alley surfaces are broken and overgrown with
weeds. The overall effect is increased greenness over the time period.
Indeed, we observed pheasants in overgrown parts of the central city.
Much of the green part of the image in Figure 1, in the inner city of
Detroit, are territories of this sort.
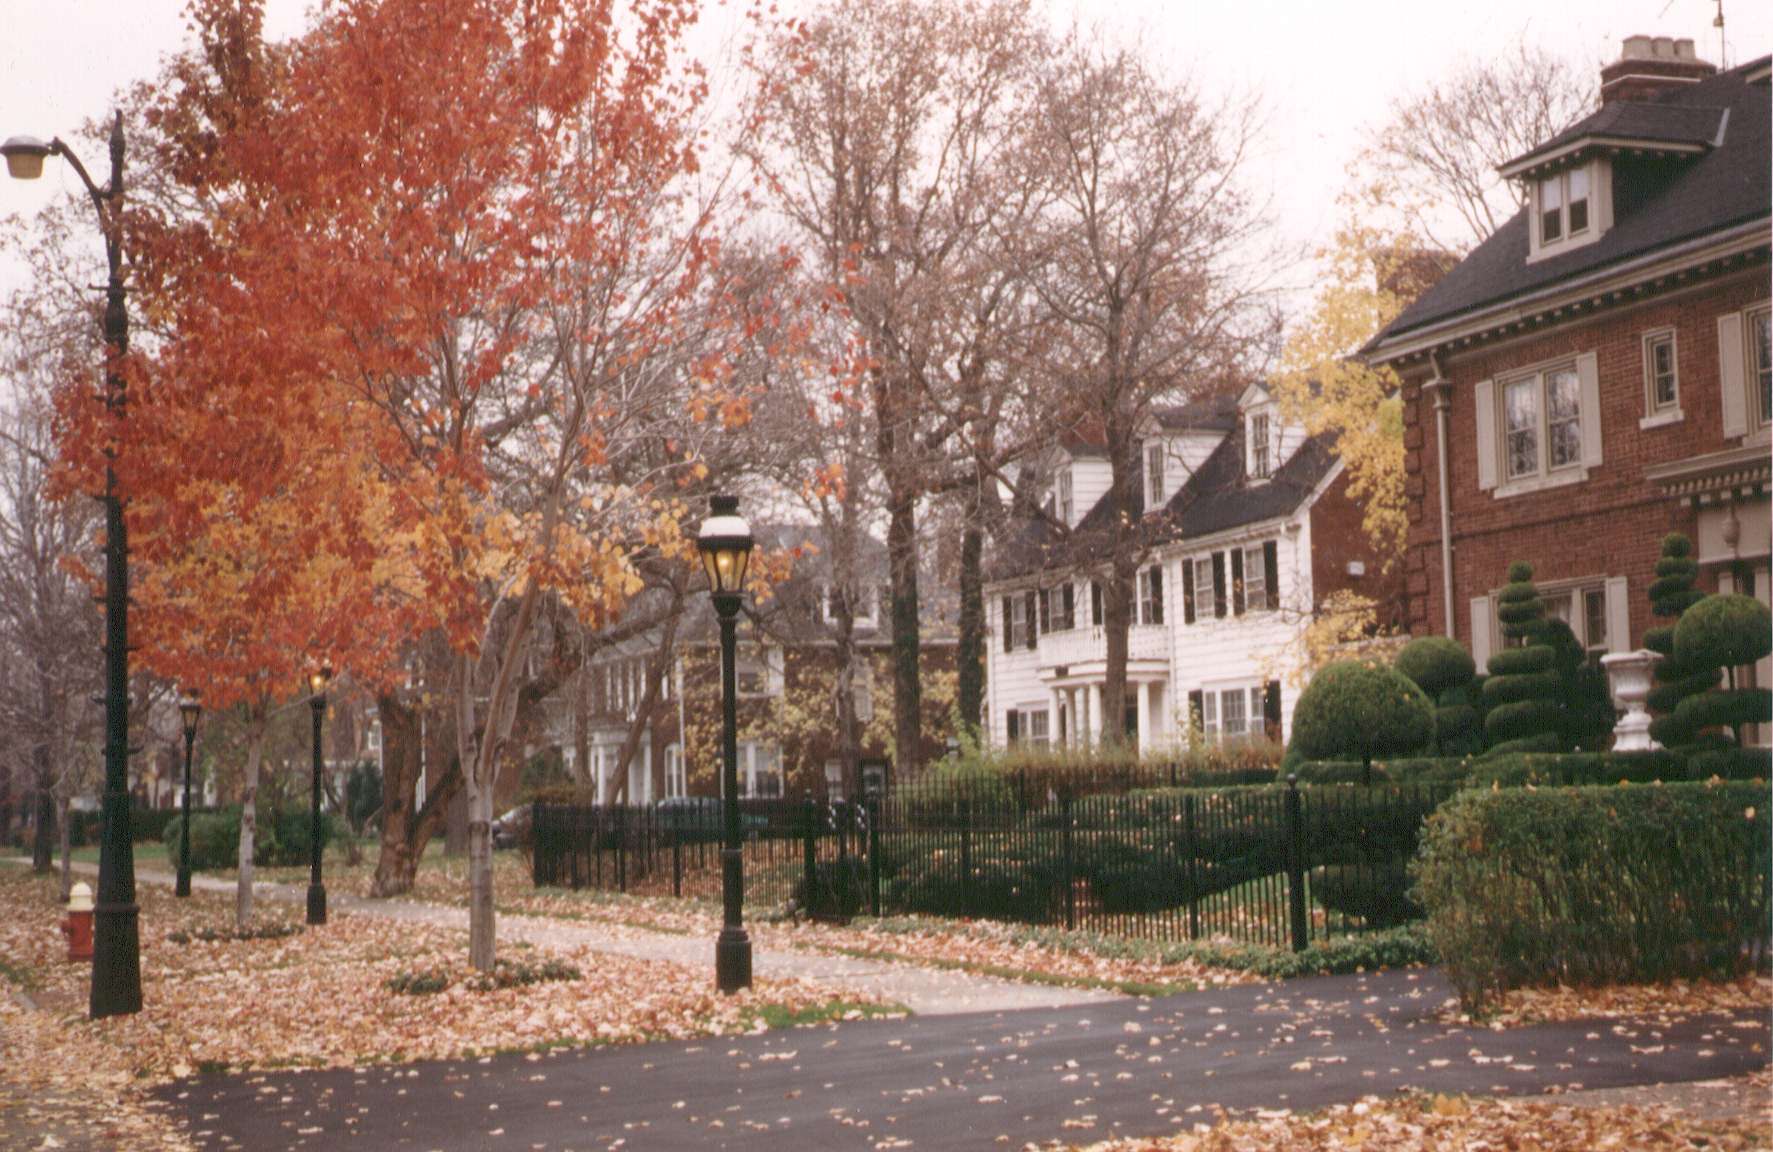
Figure 3. Ground truth, no change area--black (reference to Figure
1). In some neighborhoods in the central part of Detroit, the social
structure is intact. The physical properties of these neighborhoods
reflect this sustained social organization. This neighborhood has not
changed much and shows as mostly black in the image (Figure 1). This is
also true of cemeteries and parks where the vegetation cover has not
changed over the time period.
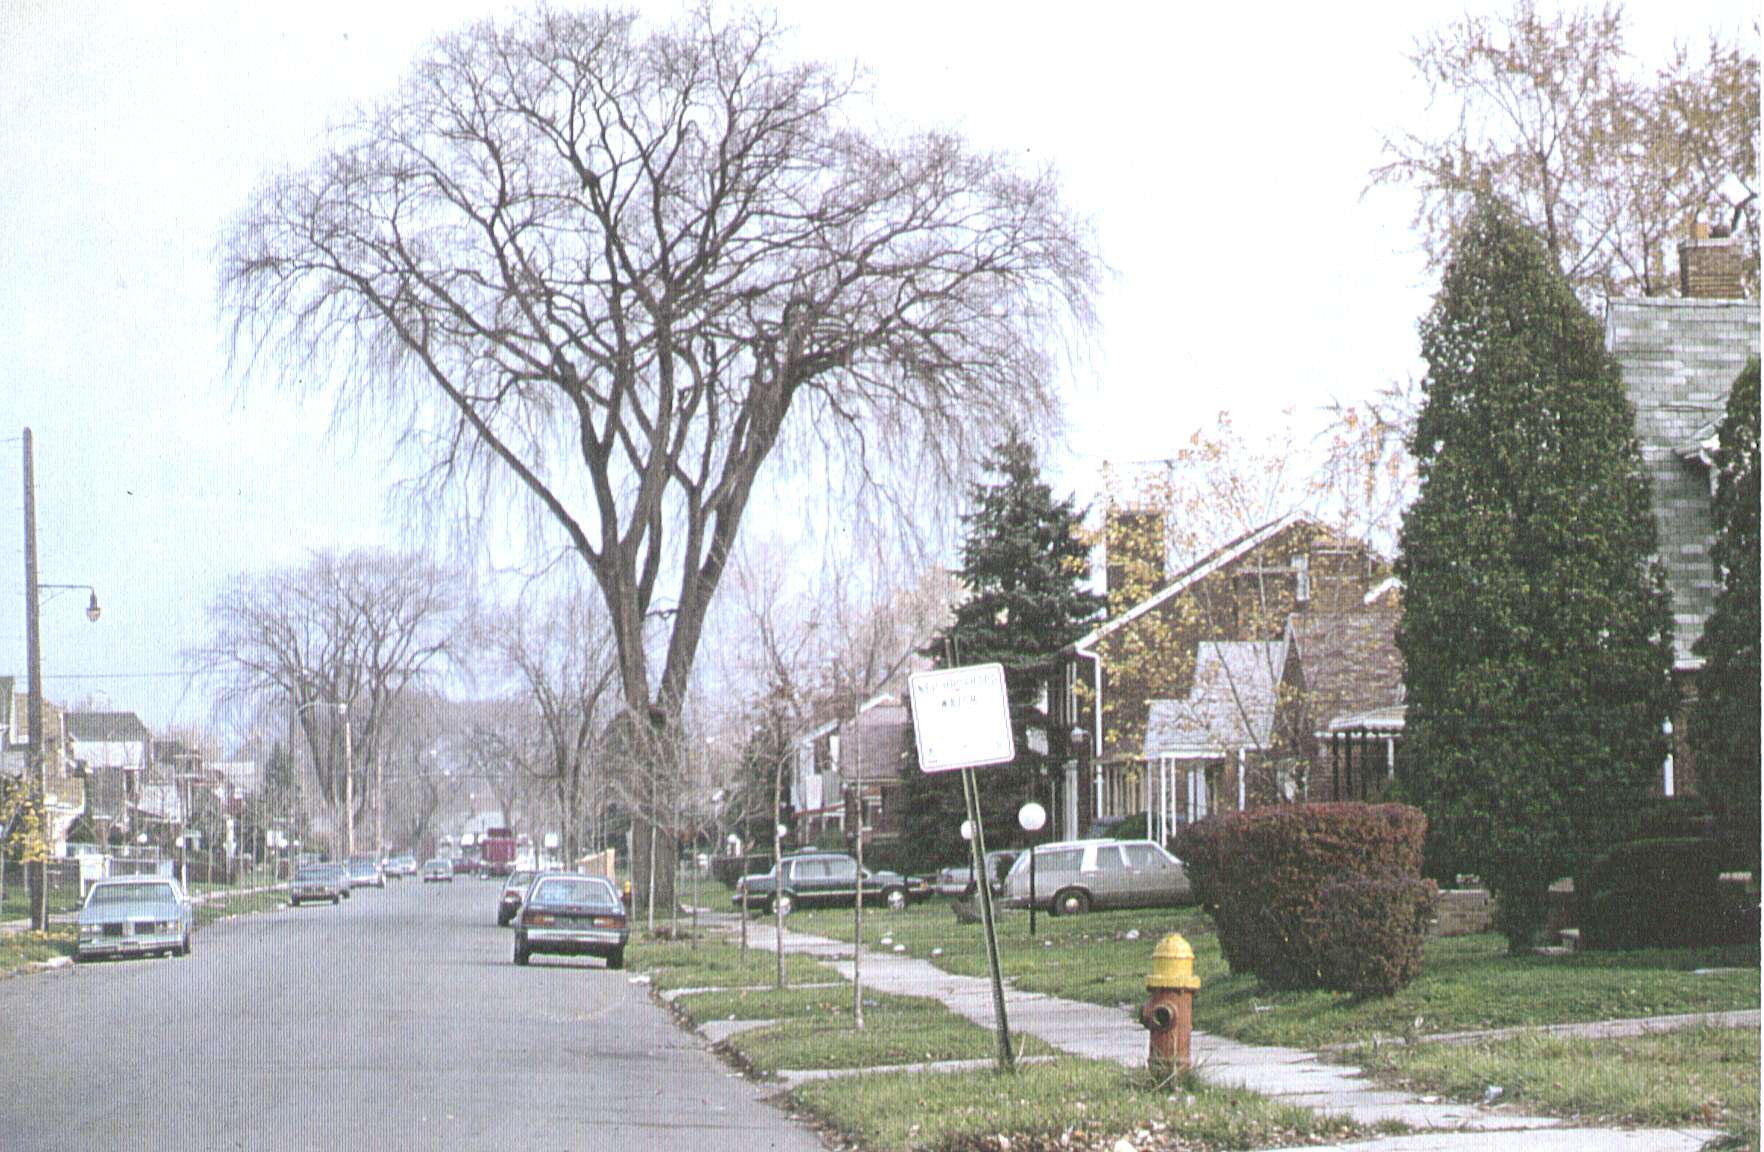
Figure 4. Ground truth, red area (reference to Figure 1). In
much of the outer edge of the city of Detroit, shown by the overlay of
census tracts in Figure 1, the social structure of the neighborhoods
remains intact but the physical changes indicate decline in vegetation
cover. By field investigation, we noted open streets with an occasional
single elm tree as shown in this figure. We attribute the decrease in
greenness to the effects of the Dutch elm disease which in the decade of
the 70s destroyed virtually the entire elm tree population. In 1975, at
the time of the image, this process was in progress. By 1992, very few
elm trees remained. In the early period, much of the street surface was
shaded by these trees, whereas currently that is not the case, despite
replanting of small trees.
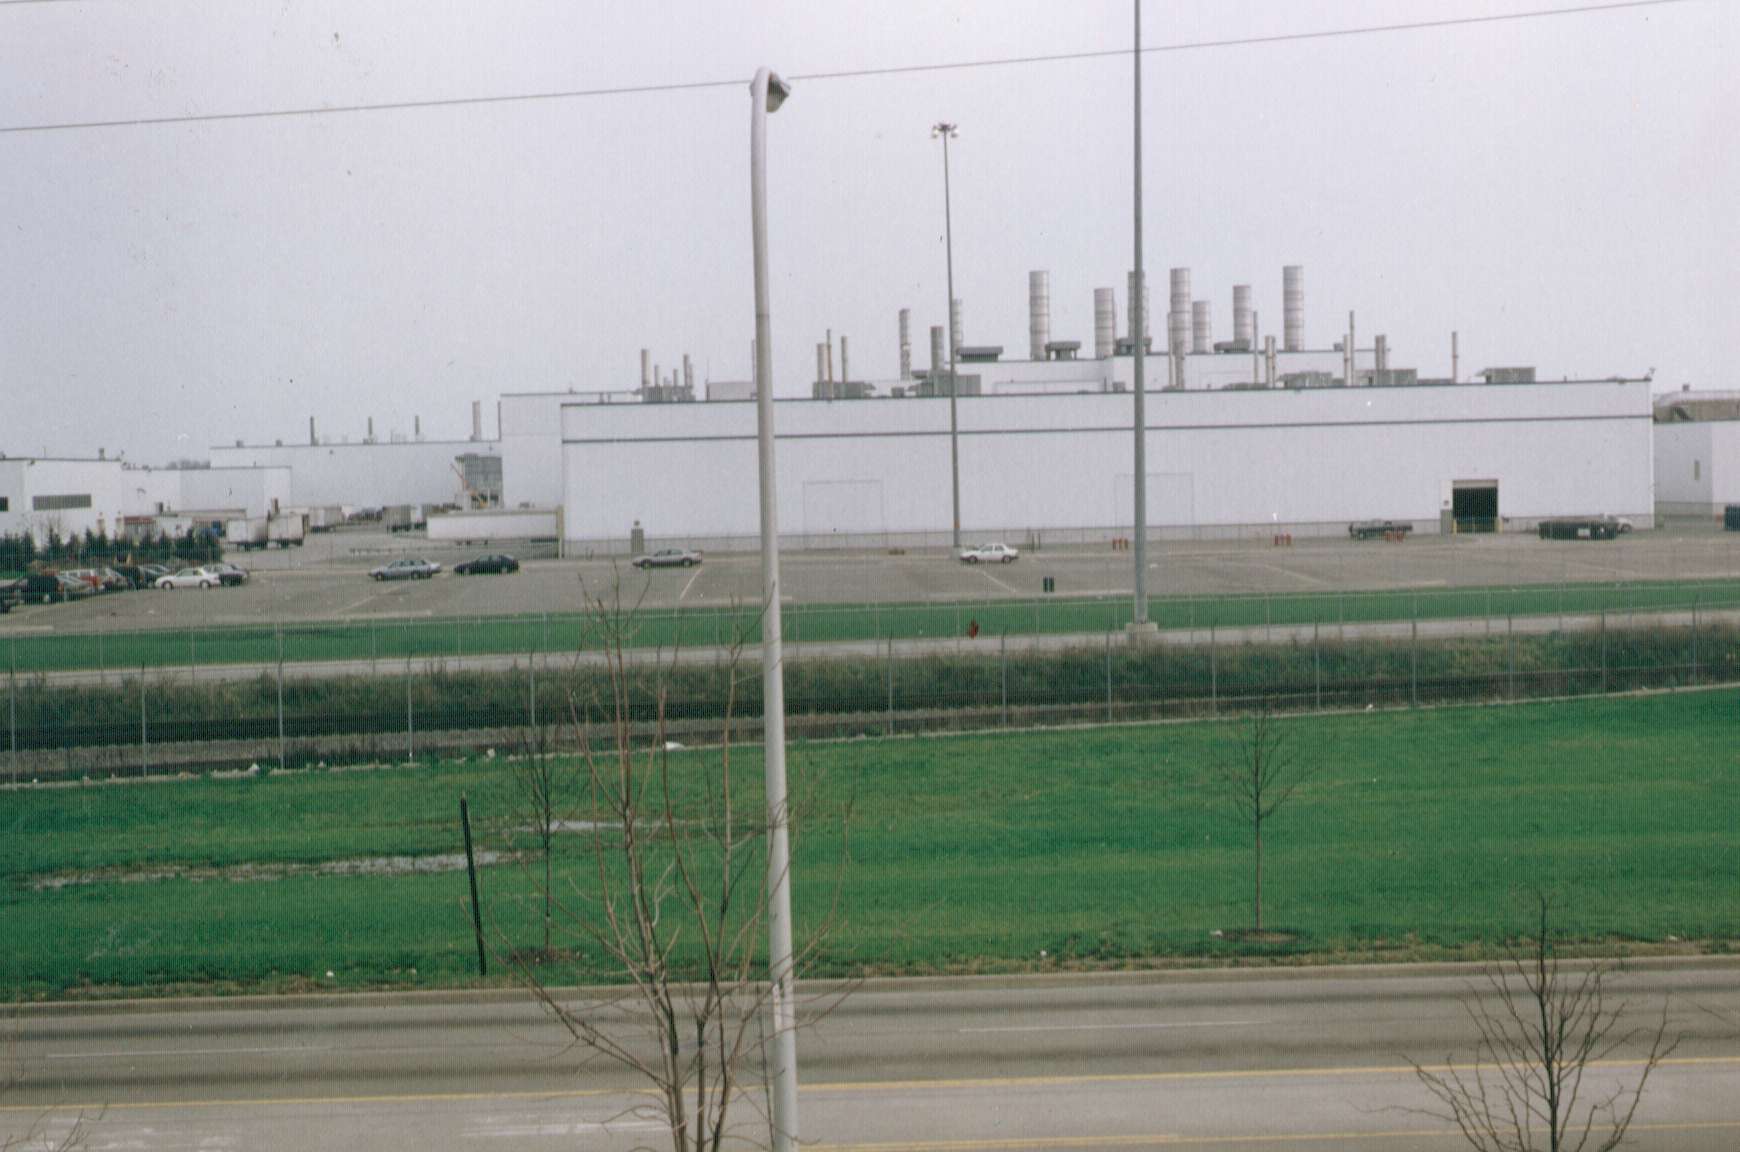
Figure 5. Figure 5 shows a recently completed automobile plant
in the City of Detroit. This location shows in Figure 1 as a red and
black region with no green. The red resulted from conversion of low
income neighborhoods, once green, to factory roof and parking lot
surface. The black areas were pre-existing industrial areas that lacked
vegetation and still have no vegetation.
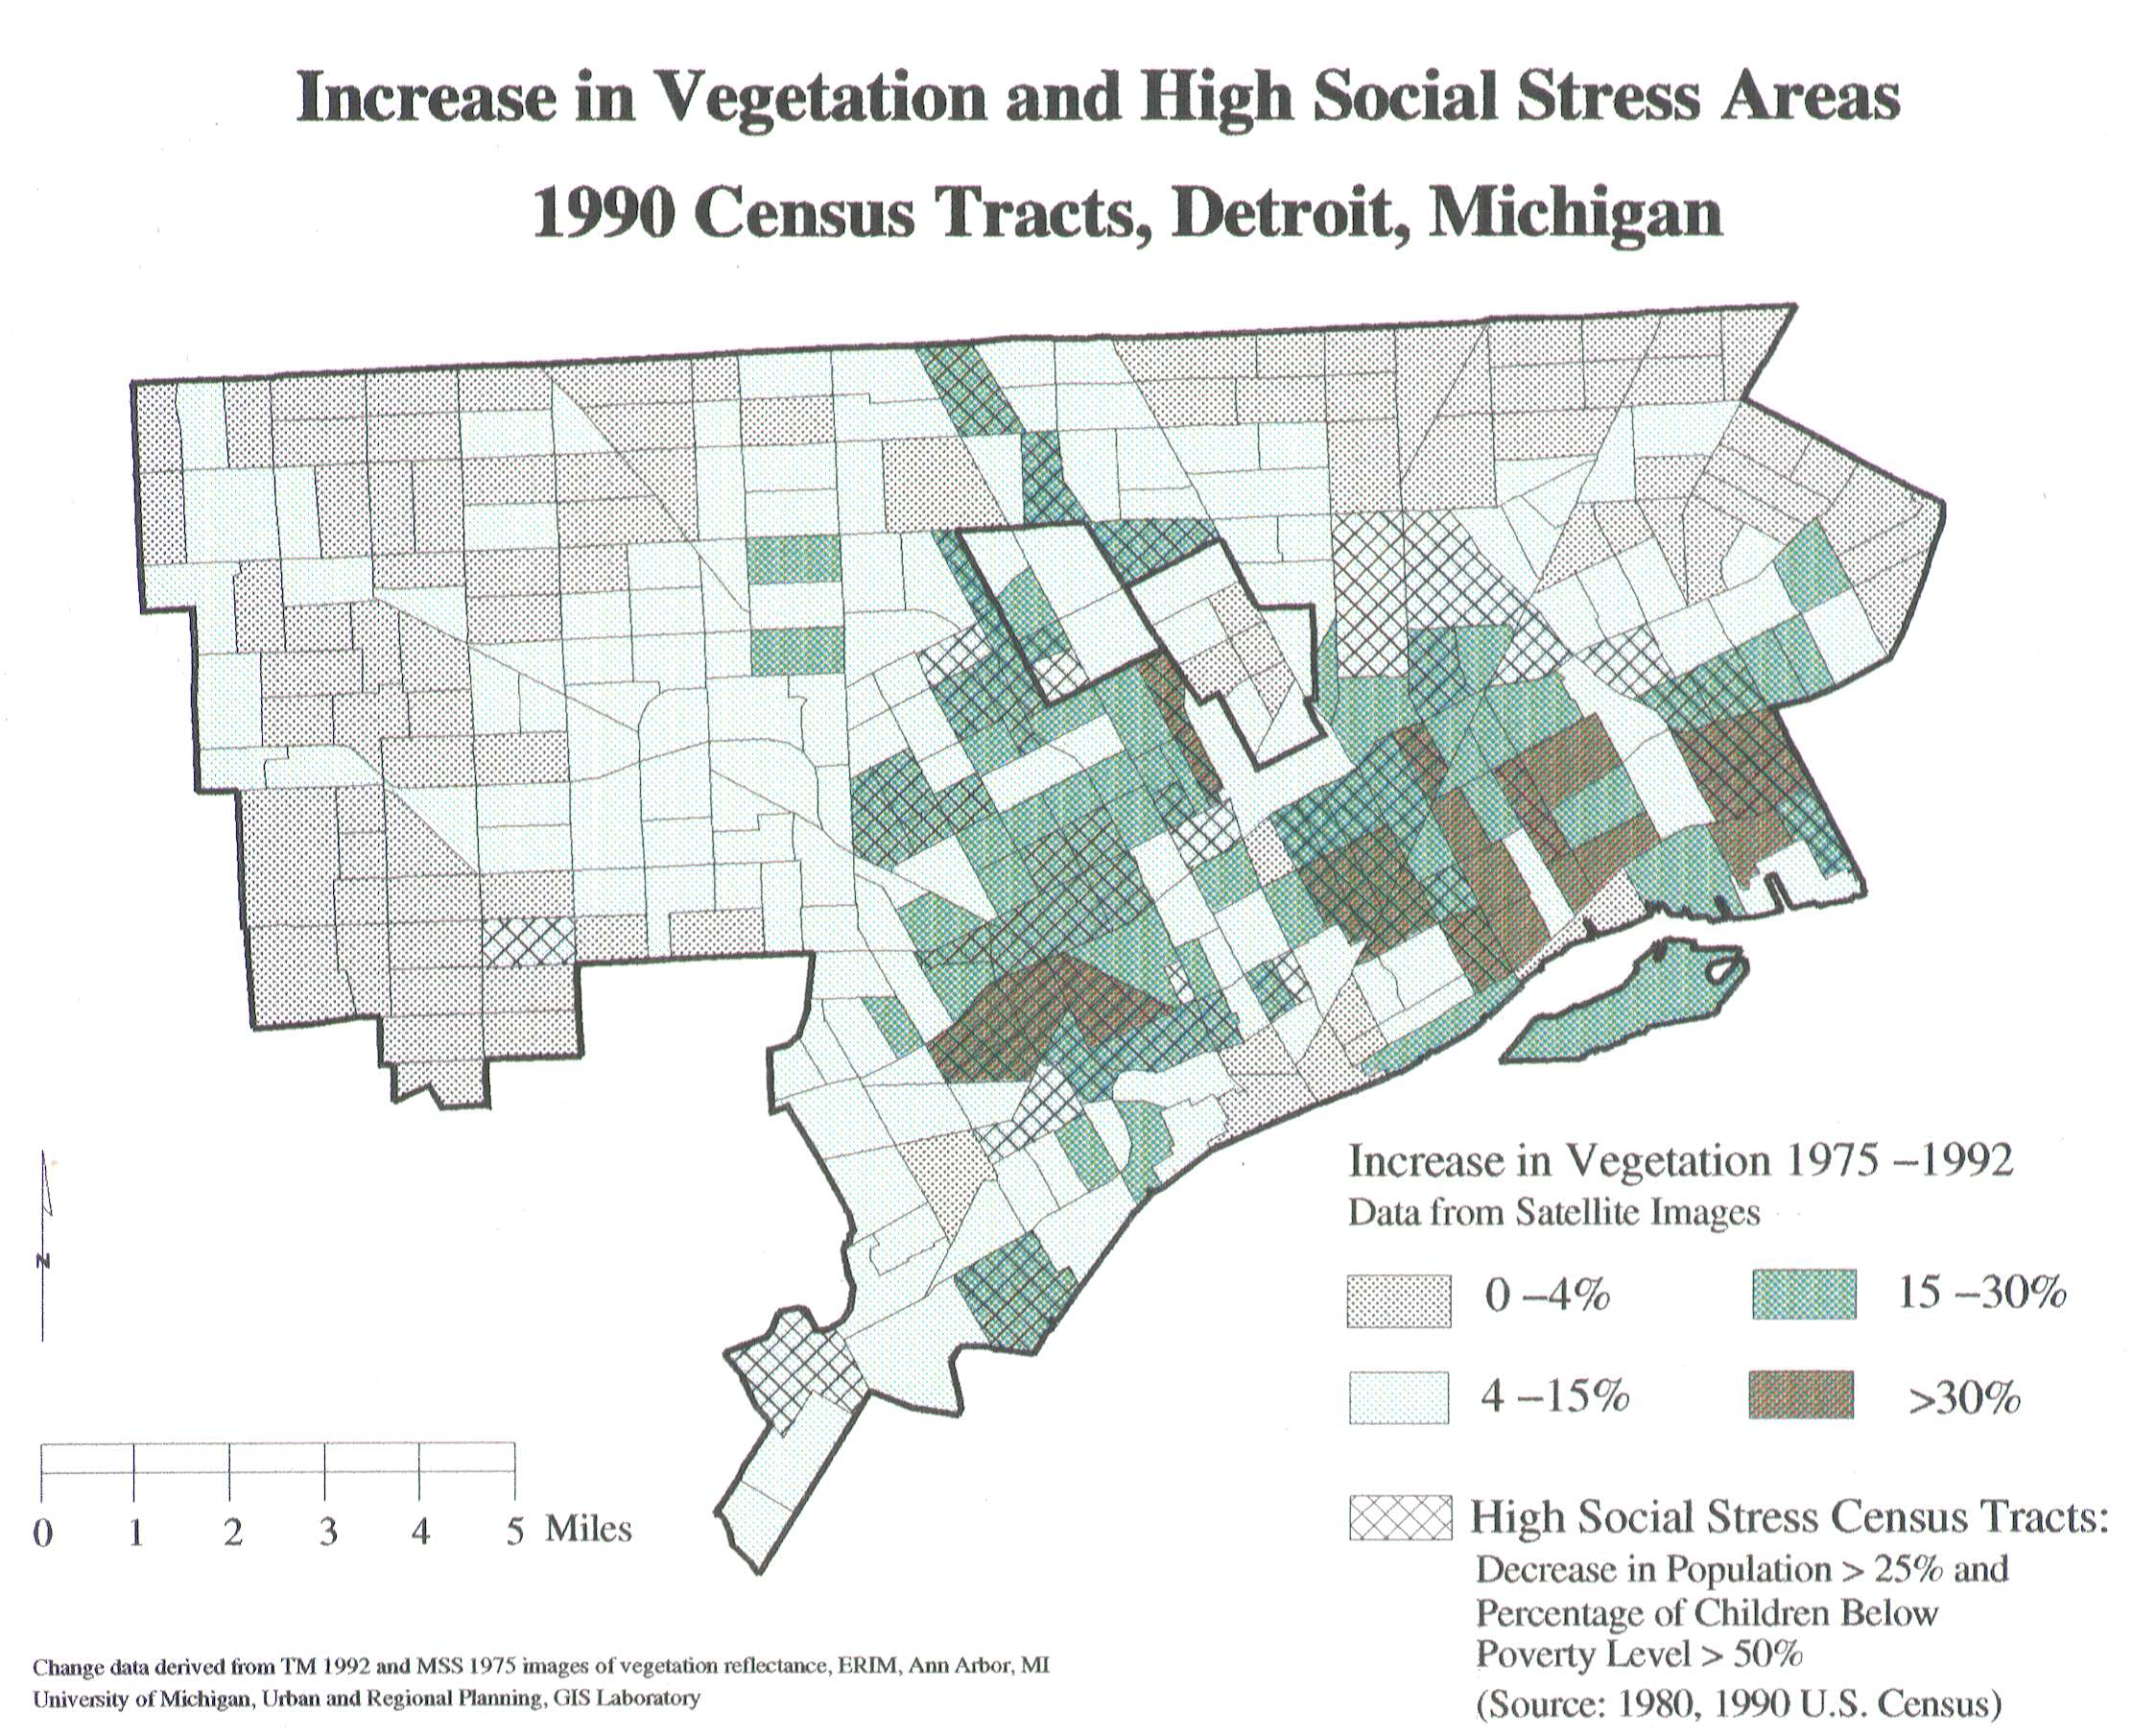
Figure 6. In Figure 6, census tracts with the largest increase in
greenness are shown with the darkest green and brown tones. Superimposed
on this colored pattern are census tracts of high social stress
(cross-hatched). High social stress census tracts are defined as those
tracts with decrease in population greater than 25% between 1980 and 1990
and with more than 50% of children below the poverty level. There
is substantial correspondence between the two patterns.
Landsat Data Analysis by ERIM
Two Landsat data sets: MSS data from May 10, 1975 and TM data from May
16, 1992 were employed in the analysis. A restoration resampling
algorithm rectified the images to the same spatial reference frame (the
State Plane Coordinate system). A principal component procedure was
employed to create a "greenness" vector from signals returned by several
spectral bands available from the satellites' instruments. The
"greenness" vector has been identified with intensity of vegetation. The
resampling and rectification allows for the creation of a change image
measuring the difference in "greenness" per pixel (at 25 meter
resolution) between the two time points separated by 17 years. The
change image was then divided into three classes: increased greenness
(colored green), no change in greenness (colored black), and decrease in
greenness (colored red) to create the image shown here. Detroit census
tracts (1990) were superimposed on this image and counts of pixels by
each class by census tracts could then be compared with census data on
socioeconomic variables. A map of percent increase in vegetation was
created by classifying census tracts by the proportion of green pixels to
total pixels contained in each. The remote sensing analysis was carried
out by the Environmental Research Laboratory of Michigan (ERIM), Ann
Arbor, Michigan. Comparisons to socioeconomic data were done by the
Urban and Regional Planning GIS Laboratory, University of Michigan.
2.
ALGEBRAIC ASPECTS OF RATIOS
Sandra Lach Arlinghaus
Institute of Mathematical Geography;
The University of Michigan;
Community Systems Foundation
To Douglas R. McManis, Editor of the Geographical Review,
whose cleverness with words has helped this author tame many a distorted
thought! Congratulations on your unparalleled service to the American
Geographical Society
(May 30, 1996).
Article to appear in Solstice: An Electronic Journal of Geography and
Mathematics, Vol. VI, No. 1, June, 1996
(http://www-personal.umich.edu/~sarhaus/image)
A particularly exciting feature of the Internet permits documents
stored on the World Wide Web to incorporate graphics, as well as text, on
the same page. It is generally easy to cut and paste text from a word
processor into the online file in which the home page is being created
(into the html file). It is almost as easy to upload an image of a
scanned photo (for example, saved in gif or jpg format) from a computer
in one's home to that same online file (or to one linked to it). Indeed,
the whole technical process is so easy, once one has a small set of keys
that open merely a few doors, that documents can be created in advance of
even simple knowledge about enduring concepts.
Thus, one might anticipate a host of web sites that do not take
account of simple cartographic principles or of drafting lessons, let
alone elements of written linguistic or mathematical style. From a more
positive standpoint, however, one might see that the creation of web
documents can serve as a favorable opportunity to cast new light on
traditional material. Practice can motivate theory: in mathematics,
geography, linguistics, or elsewhere.
Consider the simple task of creating web stationery incorporating
an established logo. The American Geographical Society (New York) has
given permission to experiment with its relatively symmetric logo that
includes a sphere (Bird, M. L., 1996). When the logo is scanned at a
relatively low resolution that even older or cheaper scanners can
produce, and loaded as a scanned image onto a Web page, the result
appears as it does below (Figure 1). The shape of the globe appears
correct to the eye, but the image is too large to be viewed on one
moderately sized computer screen. Clearly, this situation is
unsatisfactory for general use: a large image requires not only too much
visual space, but also too much computer space, and too much time to come
up on the screen. The obvious answer is to scale the image down in
size.

Figure 1.
Logo of the American Geographical Society, height 922 pixels, width 810
pixels.
With a rectangular image such scaling is of course a simple
matter: divide the width in half (for example). To retain the same
shape of image as the original, also divide the height in half (Figure
2). More generally, to retain shape when altering the scale of a
two-dimensional rectangular shape, preserve the aspect ratio--the ratio
of the horizontal dimension of an image to the vertical dimension of an
image. Varying the aspect ratio of an image causes distortion, as in
Figure 3, in which the width is divided by 2 and the height is divided by 3.
Figure 2.
Logo of the American Geographical Society, height of Figure 1 divided by
2 and width divided by 2. Correctly scaled image.
Figure 3.
Logo of the American Geographical Society, height of Figure 1 divided by
3 and width divided by 2. Distorted image.
PIXEL ALGEBRA
In the case of the AGS logo, the scanned image in Figure 1 (a
.gif file) measured 810 pixels in width and 922 pixels in height. Pixels
are the fundamental units in which these images are measured; fractions
of pixels are not permitted. The algebra of pixels is an integer algebra
that can be viewed to operate on a bounded, finite set of pixels (the
dimensions of the cathode ray tube). In the image of the AGS logo, both
dimensions are even numbers and so clearly both are divisible by 2. The
aspect ratio, 810/922, can be preserved by taking 1/2 of each dimension;
810/922 = (405*2)/(461*2) = 405/461. Are both numerator and denominator
divisible by 3?
In times when flashy applications relied more on elegant
abstractions, the distributive law was often a source of the unusual or
the cute.
DISTRIBUTIVE LAW
For integers in a domain of two operations, + and *:
Suppose that a, b, and c are integers. Then a*(b+c)=a*b + a*c.
One application of the distributive law yields the trick that to
determine whether or not a number is divisible by three, add the digits
which form it; repeat the process until a single digit is reached. If
that single digit is divisible by 3, then the entire number is divisible
by 3. In the case of the AGS logo dimensions 810 becomes 8+1+0=9 which
is divisible by 3 so that 810 is also divisible by 3. The number 922
becomes 9+2+2=13 which becomes 1+3=4 which is not divisible by 3 so that
922 is not divisible by 3. Thus, 1/3 would not be a scaling factor for
the scanned AGS logo that would preserve the aspect ratio: 3 is not a
factor of both the numerator (810) and the denominator (922) of the
aspect ratio of 810/922.
To see why this procedure is an application of the distributive
law, work through 810 as an example, and note that numbers such as 9,
99, 999 are always divisible by 3 (conversation with W. C. Arlinghaus):
810 = 8*100 + 1*10 + 0*1 --- first use of distributive law
= 8*(99+1) + 1*(9+1) + 0*1 --- partitioning of powers of ten into
convenient summands
= 8*99 + 8*1 + 1*9 + 1*1 + 0*1 --- second use of distributive law
= 8*99 + 1*9 + 8*1 + 1*1 + 0*1 --- commutative law of addition (a+b=b+a)
notice that the sum 8*99 + 1*9 is divisible by 3 because 9 and 99 are
divisible by 3:
8*99 + 1*9 = (8*33 + 1*3)*3--third use of the distributive law, so now,
810 = (8*33 + 1*3)*3 + (8*1 + 1*1 + 0*1) and for the number 810 to be
divisible by 3 (fourth use of the distributive law) all that is thus
required is for the right summand in parentheses, 8*1 + 1*1 + 0*1 to be
divisible by 3. Hence, the rule of three, for determining whether or not
a given integer is divisible by 3 becomes clear.
A corresponding rule of nine is not difficult to understand, as are
numerous other shortcuts for determining divisibility criteria. Clearly,
one need test candidate divisors only up to the square root of the number
in question. However, when one is faced with an image on the screen, it
would be nice not to have taken the trouble (however little) of finding
that 810 is divisible by 3, only to find that 922 is not. A far better
approach is to rewrite each number using some systematic procedure and
then compare a pair of expressions to determine, all at once, which
numbers are divisors of BOTH 810 and 922. For this purpose, the
Fundamental Theorem of Arithmetic is critical.
FUNDAMENTAL THEOREM OF ARITHMETIC
Any positive integer can be expressed uniquely as a product of
powers of prime numbers (numbers with no integral divisors other than
themselves and one).
Thus, in the AGS logo example,
810=2*405=2*5*81=2*3*3*3*3*5 (superscripts avoided by repetitive
multiplication) and,
922=2*461.
The number 810 was easy to reduce to its unique factorization into powers
of primes; one might not know whether or not 461 is a prime number or
whether further reduction is required to achieve the prime power
factorization of 922.
To this end, the Sieve of Eratosthenes (the same Librarian at Alexandria
who measured the circumference of the Earth) works well. To use the
sieve, simply test the prime numbers less than the square root of the
number in question. The square root of 461 is about 21.47. So, the only
primes that can possibly be factors are: 2, 3, 5, 7, 11, 13, 17, and
19. Clearly, 2, 3, and 5 are not factors of 461. A minute or two with a
calculator shows that 7, 11, 13, 17, and 19 are also not factors of 461.
Notice that these calculations need only be made once--when one has the
unique factorization all divisors of both numbers are known from looking
at the two factorizations, together. Thus:
810 = 2*3*3*3*3*5
922 = 2 * 461
and 2 is the only factor common to both numbers.
PRESERVATION OF THE ASPECT RATIO
Because the only factor the two numbers 810 and 922 have in
common is 2 it follows that the only scaling factor that can be used,
THAT WILL PRESERVE THE ASPECT RATIO, is 1/2. Had 1/3 or some other ratio
been employed, a distorted view of the AGS logo would have been the
result. Figure 4 shows the result of using a scaling factor of 1/10, so
that the image is 81 pixels wide and 92 pixels high (rounded off from
92.2 pixels). The image looks good, but in fact the aspect ratio was not
preserved. Level of sensitivity to image distortion will vary with the
individual; it is important to have absolute techniques that guarantee
correct answers. Once one knows them, then one can choose when, and when
not, to violate them.
Figure 4.
Logo of the American Geographical Society, height and width divided by
10, aspect ratio not preserved. Distortion present but not evident.
Reduction of the AGS logo by 1/2, producing an image 1/4 of the
original size, may still not be desirable. One can use the unique
factorization to build what is desired. The value of 810 has a number of
factors; thus, one might choose to rescan the image, holding the width at
810 pixels and shaving just a bit off the height (there appears to be
room to do so in the background without touching the line drawing of the
globe). Now, to create the possibility of various scaling factors,
consider a tiny sliver removed to create a height of 920 = 2*2*2*5*23;
there is an extra factor of 5 that 920 has in common with 810 that 922
did not, so all of 1/2, 1/5, and 1/10 (one over 2*5) are scaling factors
that will preserve the aspect ratio. However, one might wish still more
possible scaling factors; if a slightly larger sliver can be removed, so
that the height of the scanned image is 900 pixels, with 900 =
2*2*3*3*5*5, then 810 and 900 have common prime power factors of 2, 3,
3*3, and 5, so that the set of scaling factors has been substantially
expanded to include all of:
1/2, 1/3, 1/9, 1/5, combination of four things
one at a time--4!/(1!*3!)
1/6, 1/18, 1/10; 1/27, 1/15; 1/45 combination of four things two at
a time--4!/(2!*2!)
1/54, 1/30, 1/90, 1/135 combination of four things
three at a time--4!/(3!*1!)
1/270 combination of four
things four at a time--4!/(4!*0!).
This set of values for the height, in pixels, should offer enough choices
in various size ranges for the stationery to have a logo of reasonable
size on it.
IMAGE SECURITY
In creating images, it is useful to have an aspect ratio with
numerator and denominator with many common factors; greater flexibility
in changing the image is a consequence. However, there may be
situations, particularly on the Internet where downloading is just a
right-click of the mouse away, in which one wishes to inhibit easy
rescaling of an image. When that is the case, unique factorization via
the Fundamental Theorem of Arithmetic again yields an answer: choose to
scan the image so that the numerator and denominator of the aspect ratio
are relatively prime--that is, so that numerator and denominator have no
factors in common other than 1. In the case of the AGS logo, altering
the aspect ratio from the original of 810/922 to 810/923 would serve the
purpose: 923 is not divisible by any of 2, 3, or 5. Anyone downloading
the AGS logo could not resize it without distortion: distortion, for
once, becomes the mapmaker's friend.
FINALE
The abstract lessons learned in Modern Algebra are as important
in the electronic world as they are elsewhere; indeed, the current
technical realm therefore offers a refreshing host of new example to
motivate theory, as suggested in this simple scaling example that drew on
a variety of algebraic concepts including: the distributive law, the
commutative law of addition, the Fundamental Theorem of Arithmetic and
the needed associated concept of prime number, facts involving square
roots and divisors, the Sieve of Eratosthenes, basic material on
permutations and combinations together with the convention that 0!=1, and
the idea of relatively prime numbers. The web is a rich source of
example when one brings a rich source of abstract liberal arts training
to it.
CITATIONS
Bird, M. L. Executive Director, American Geographical Society, May, 1996.
REFERENCES
For the reader wishing to learn more about modern algebra--not easy
reading for most, but well worth looking at to gain some appreciation for
the vastness of this field.
Birkhoff, G. and Mac Lane, S. A Survey of Modern Algebra. Macmillan,
Herstein, I., N. Topics in Algebra.
Mac Lane, S. and Birkhoff, G. Algebra.
3. EDUCATION GRAPHIC ESSAY
U.S. ROUTE 12 BUFFER
Daniel Jacobs
The University of Michigan
A child's turf is an ordered space in which the child plots data
points at important spots. I will use maps generated on a geographical
information system (Atlas GIS for Windows, v. 3.0) as one set of tools to
broaden student perspective. The student population will be mainly 9-10
year old students from urban and suburban settings. I hope to initially
probe three areas of student perspectives:
a. Their sense of space immediately around them in their daily
lives, including their school, home, block, city, county, and state;
b. Their sense of the order of the physical world around them,
including cardinal directions, directions of major roads and highways,
positions of buildings, cities, and states along U.S. 12 (base map in
Figure 1);
c. Their knowledge of the people, buildings, and stories behind
their known turf (sample of a map set shown in Figure 2).
I am most interested in finding where different student maps end,
where their Unknown begins, and what they think is beyond.
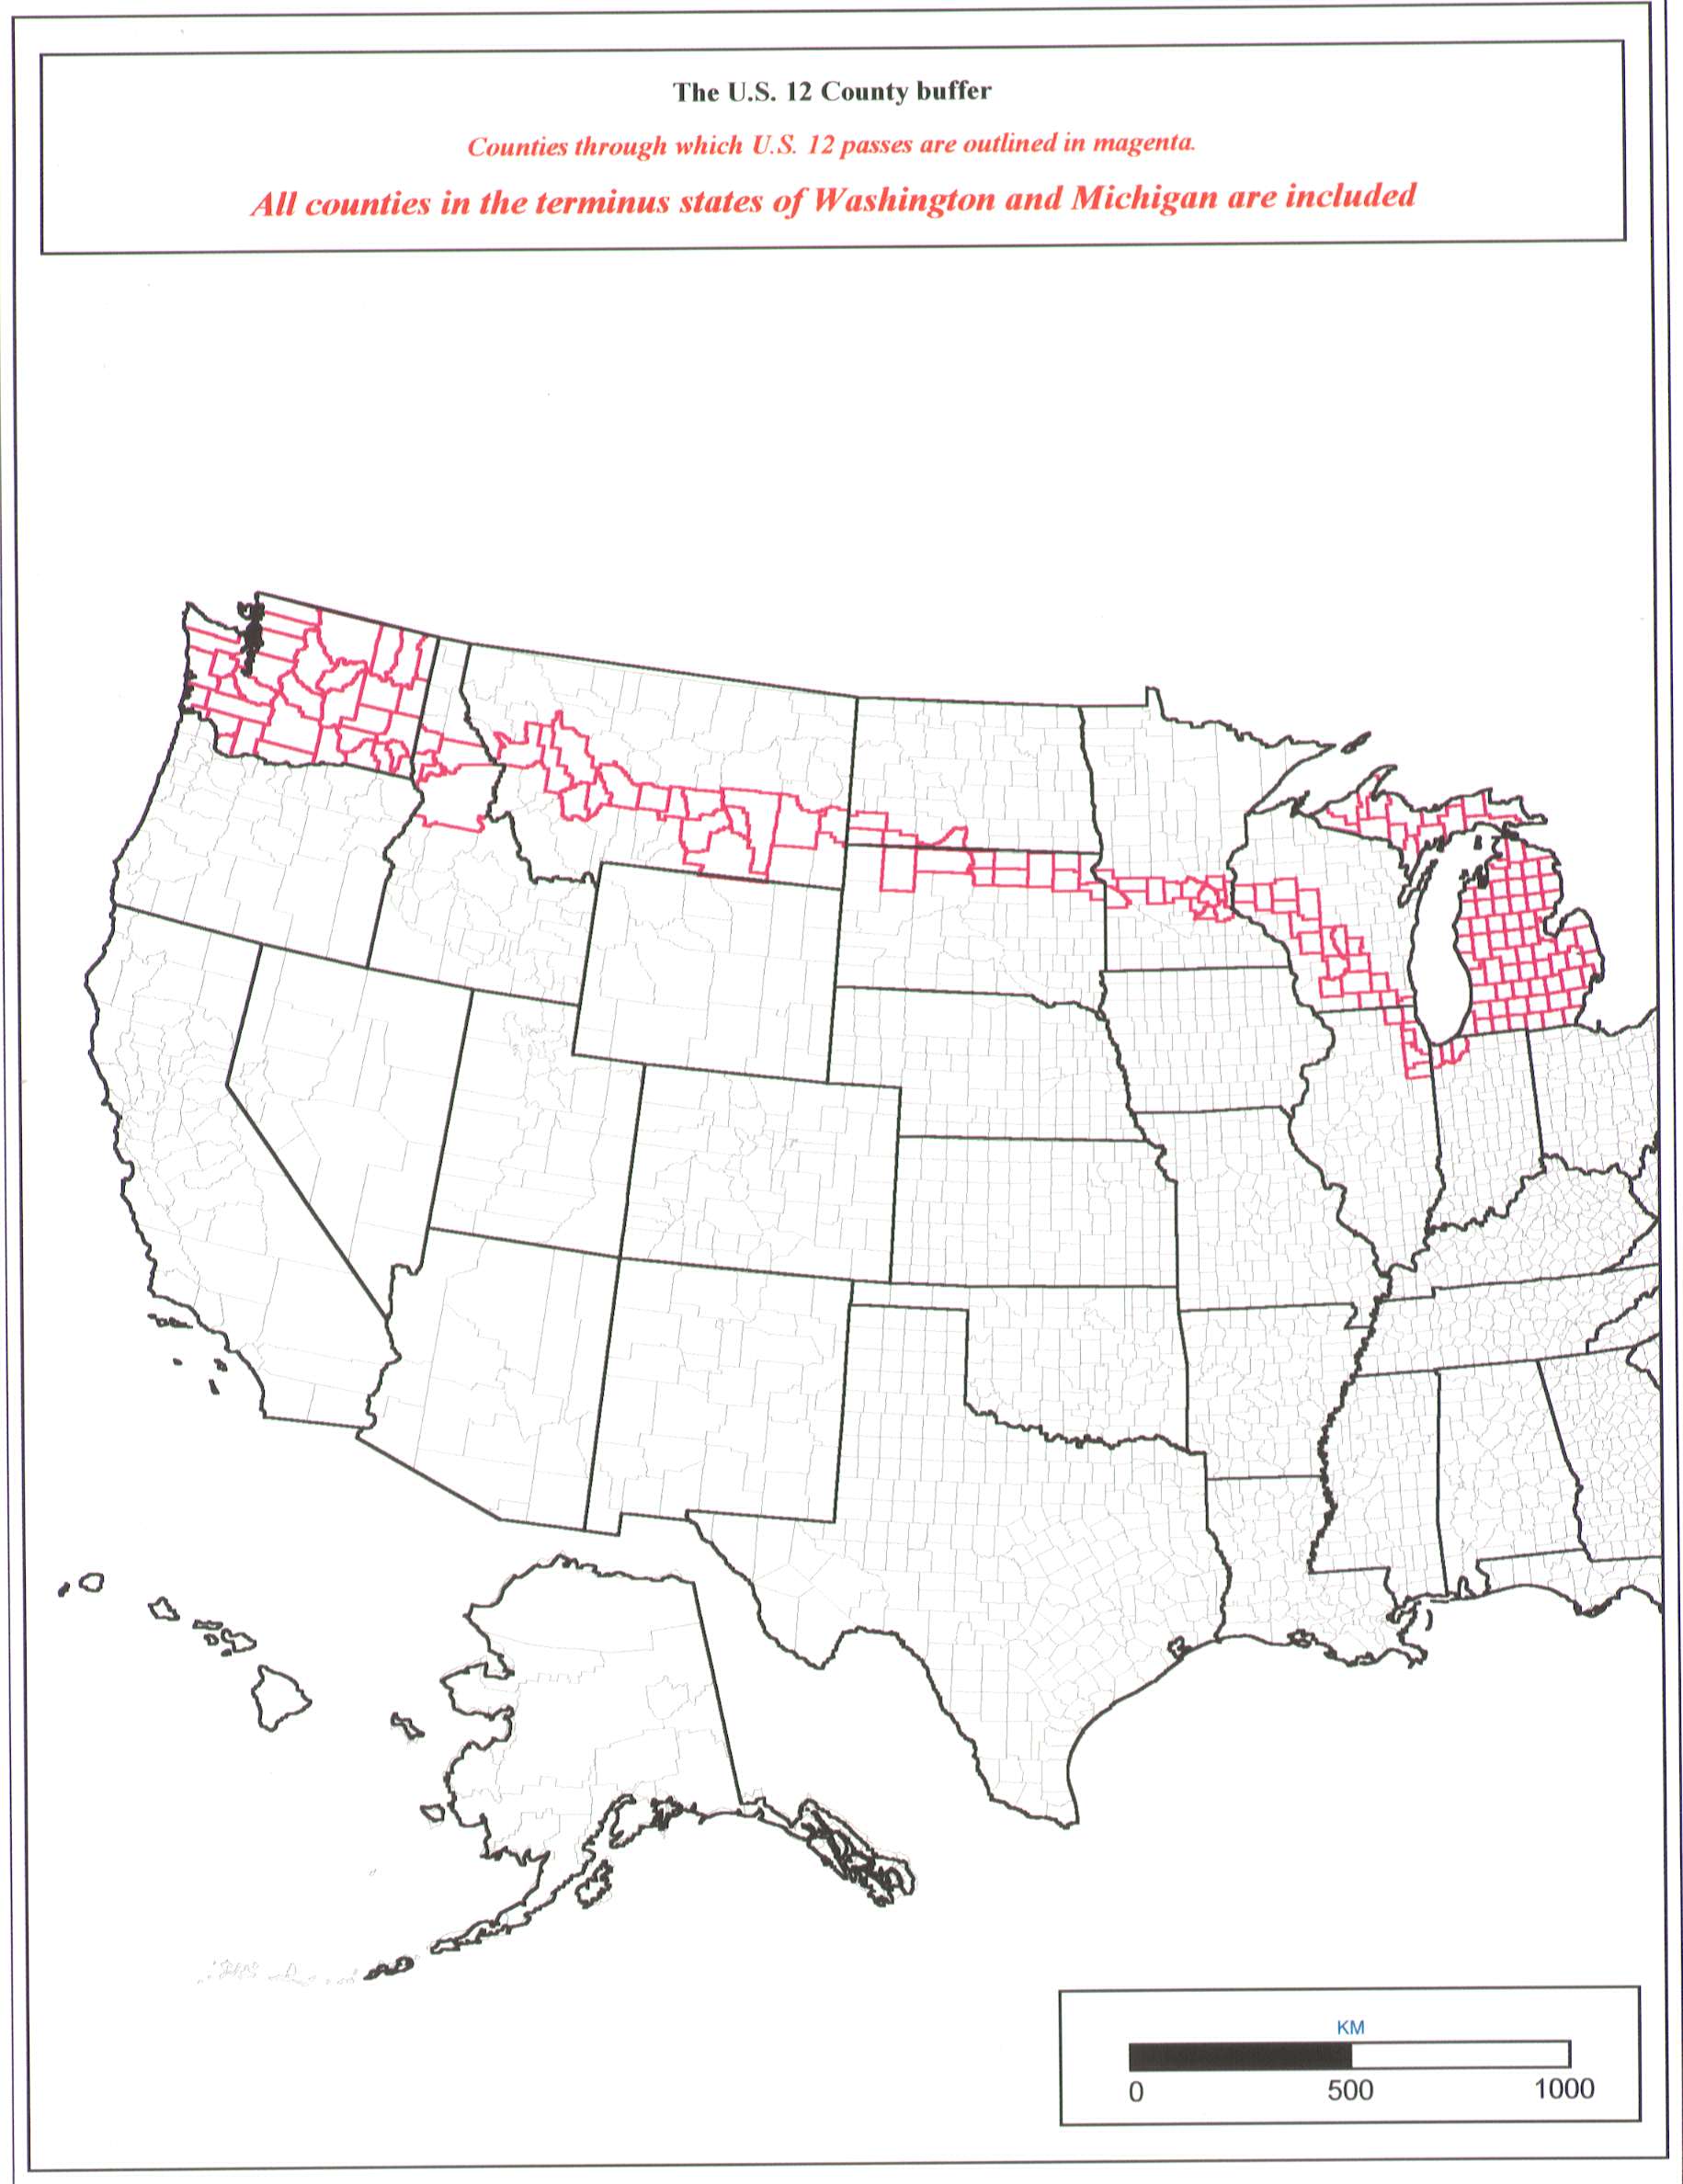
Figure 1. U.S. 12 county buffer.
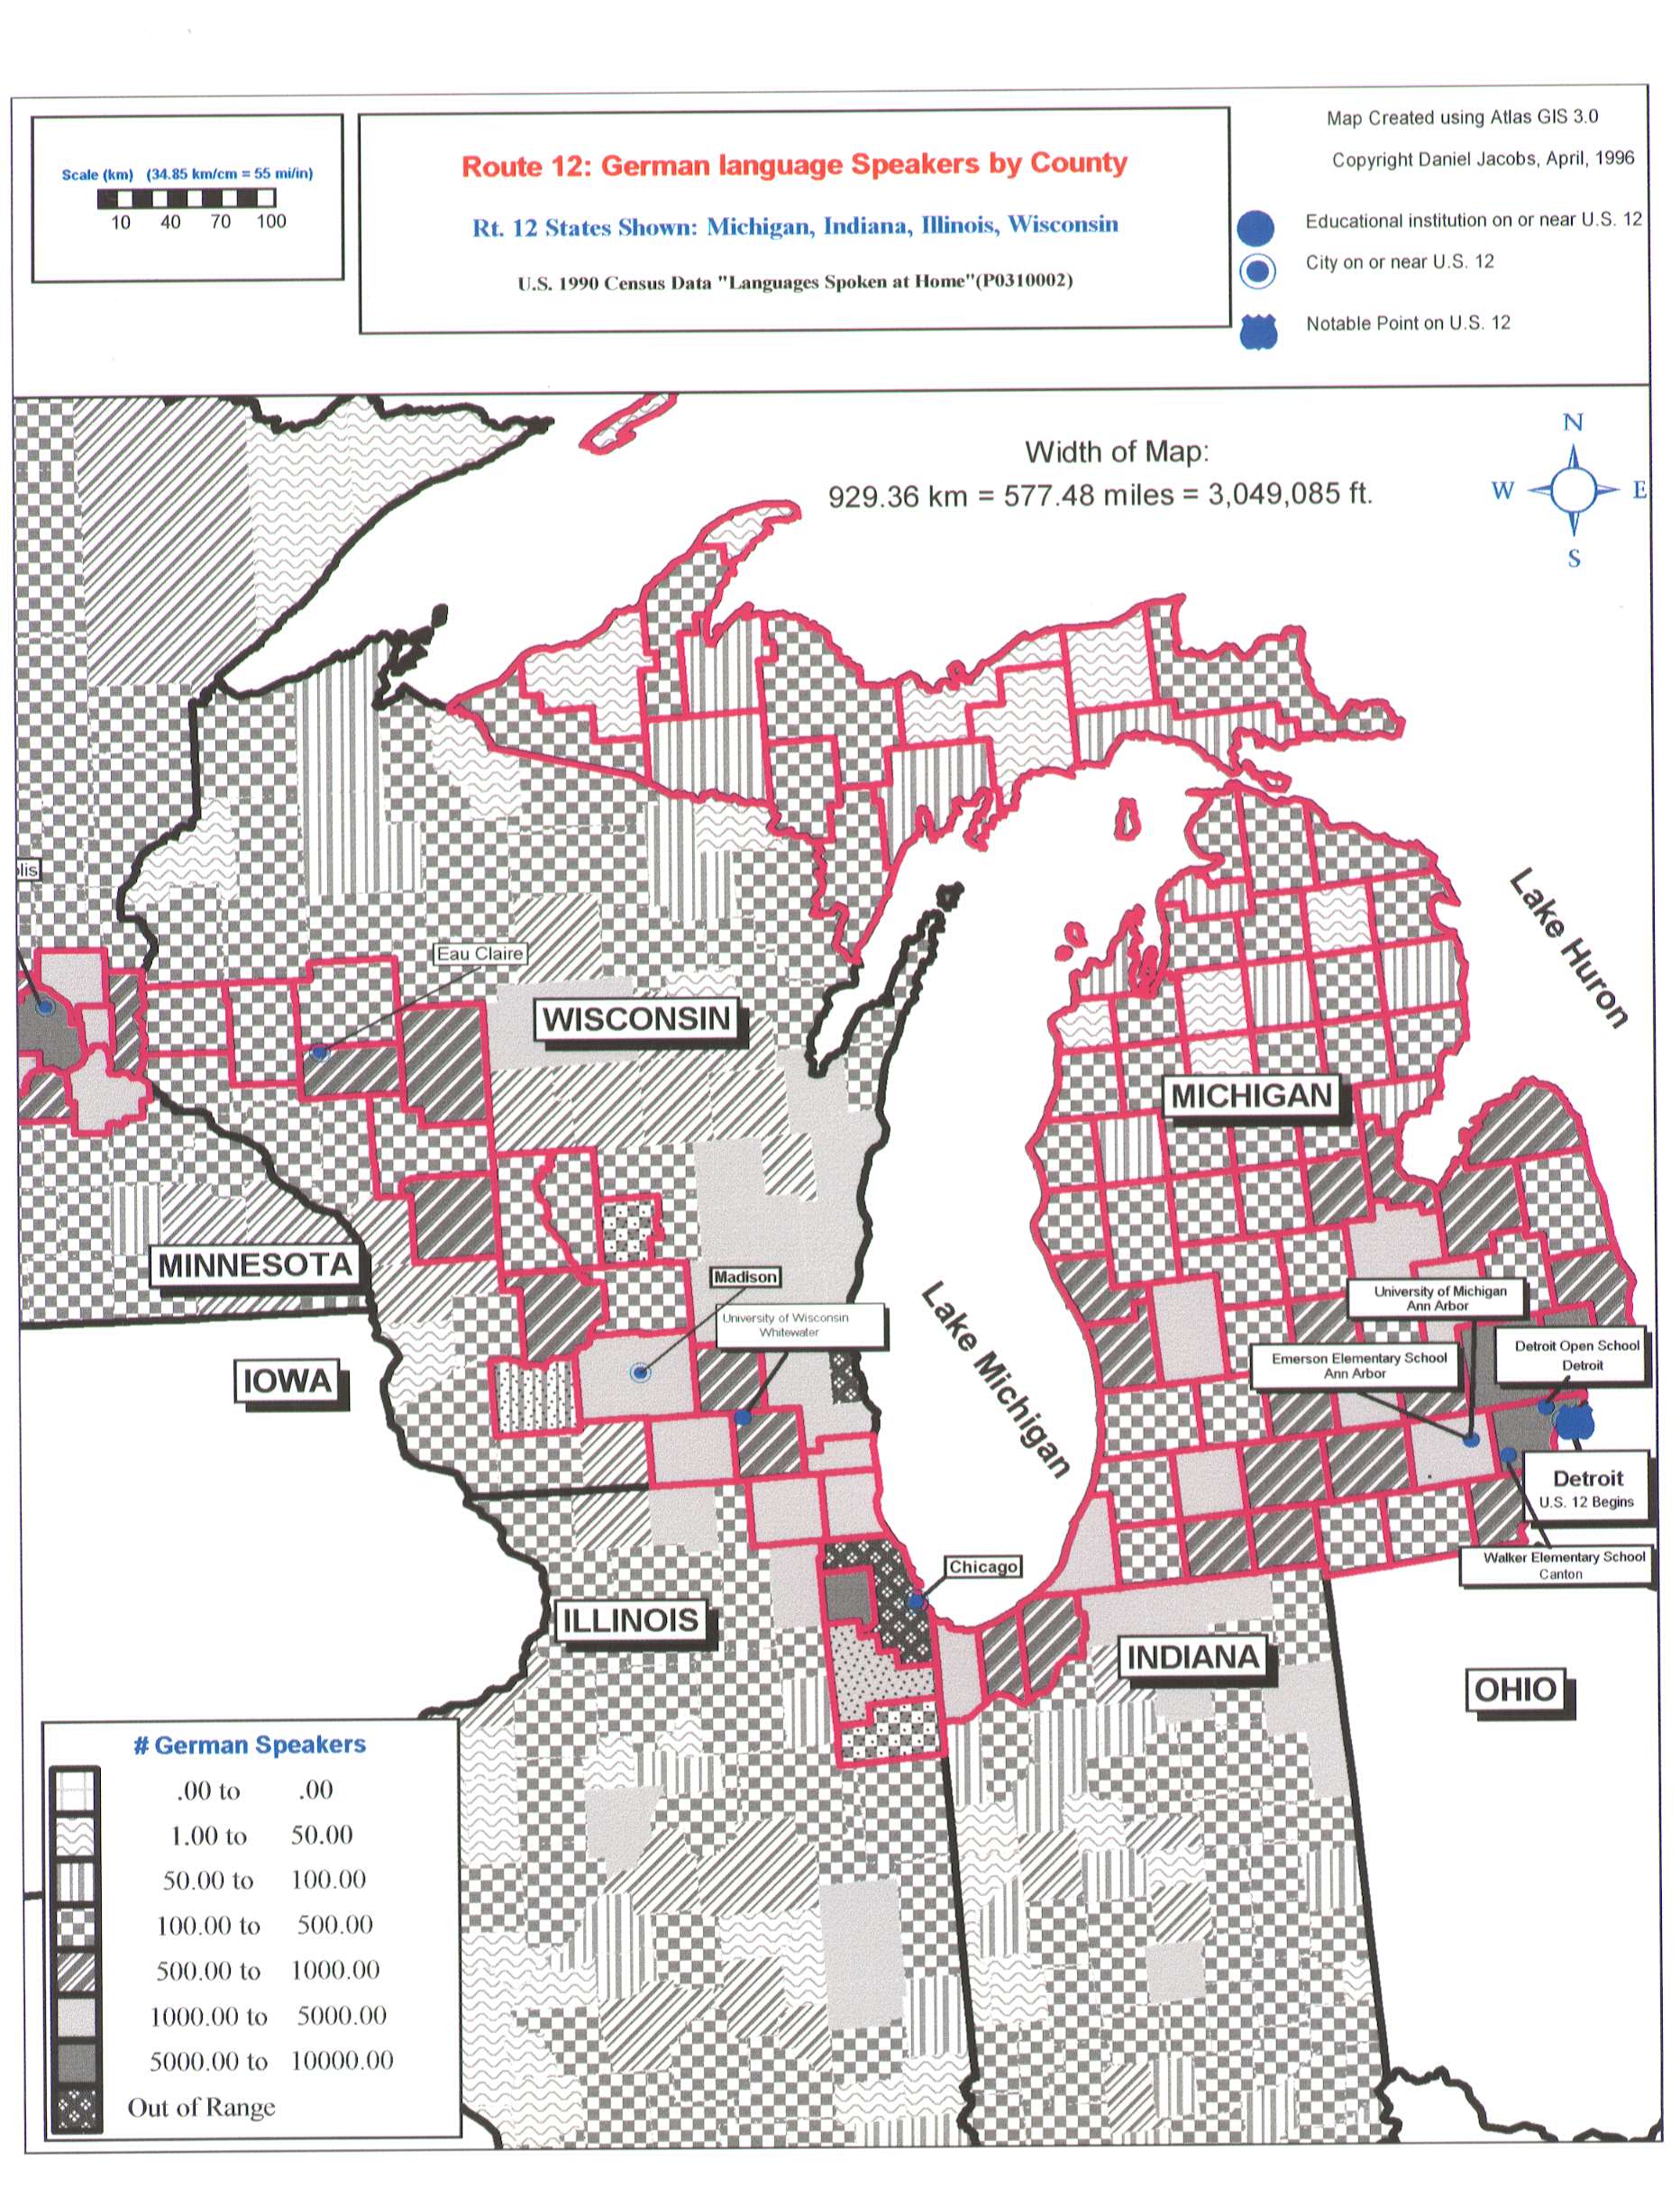
Figure 2. Number of German speakers by county; U.S. 12 buffer
outlined in magenta. The U.S. Census measures 24 distinct language
categories under the heading of "Languages Spoken at Home." To ensure
legibility, I have divided the U.S. into four sections and am generating
four maps for each of the measured language groups. The ultimate goal of
the Route 12 project is to organize stuednts, teachers, schools, and
institutions along Route 12 into a coherent education community.
NOTE: Teachers and students from Detroit have already used the maps and
student information to visit classes in schools across Michigan. The
Detroit students and their travels will serve as a template for the
development of one to two day field trips in which students from Detroit
travel to other route 12 schools and exchange historical and cultural
information. Studnets in Detroit have been interviewing individuals who
speak languages other than Enlish at home. Coupled with the maps I have
generated, the interviews are intended to help students gain a sense of
the variety of languages, nationalities, and ethnicities represented
within their own neighborhoods.
4. INDEX TO VOLUMES I (1990) TO VOL. VI
--------------------
Vol. VI, No. 2, December, 1995. TABLE OF CONTENTS
Elements of Spatial Planning: Theory--Part I.
Sandra L. Arlinghaus
MapBank: An Atlas of On-line Base Maps
Sandra L. Arlinghaus
International Society of Spatial Sciences
Volume VI, Number 1, June, 1995.
Fifth Anniversary of Solstice
New format for Solstice and new Technical Editor
Richard Wallace. Motor Vehicle Transport and Global Climate Change:
Policy Scenarios.
Expository Article. Discrete Mathematics and Counting Derangements in
Blind Wine Tastings.
Sandra L. Arlinghaus, William C. Arlinghaus, John D. Nystuen
--------------------
Volume V, No. 2, Winter, 1994.
Sandra L. Arlinghaus, William C. Arlinghaus, Frank Harary: The Paris
Metro: Is its Graph Planar?
Planar graphs; The Paris Metro; Planarity and the Metro;
Significance of lack of planarity.
Sandra Lach Arlinghaus: Interruption!
Classical interruption in mapping; Abstract variants on interruption
and mapping; The utility of considering various mapping surfaces--GIS;
Future directions.
Reprint of Michael F. Dacey: Imperfections in the Uniform Plane.
Forewords by John D. Nystuen.
Original (1964) Nystuen Foreword; Current (1994) Nystuen Foreword;
The Christaller spatial model; A model of the imperfect plane; The
disturbance effect; Uniform random disturbance; Definition of the basic
model; Point to point order distances; Locus to point order distances;
Summary description of pattern; Comparison of map pattern; Theoretical
model; Point to point order distances; Locus to point order distances;
Summary description of pattern; Comparison of map pattern; Theoretical
order distances; Analysis of the pattern of urban places in Iowa; Almost
periodic disturbance model; Lattice parameters; Disturbance variables;
Scale variables; Comparison of M(2) and Iowa; Evaluation; Tables.
Sandra L. Arlinghaus: Construction Zone: The Brakenridge-MacLaurin
Construction.
William D. Drake: Population Environment Dynamics: Course and
Monograph--descriptive material.
----------------------------
Volume V, No. 1, Summer, 1994.
Virginia Ainslie and Jack Licate: Getting Infrastructure Built.
Cleveland infrastructure team shares secrets of success;
What difference has the partnership approach made; How process
affects products--moving projects faster means getting more public
investment; difference has the partnership approach made; How process
affects products--moving projects faster means getting more public
investment; How can local communities translate these successes to their
own settings?
Frank E. Barmore: Center Here; Center There; Center, Center Everywhere.
Abstract; Introduction; Definition of geographic center; Geographic
center of a curved surface; Geographic center of Wisconsin; Geographic
center of the conterminous U.S.; Geographic center of the U.S.; Summary
and recommendations; Appendix A: Calculation of Wisconsin's geographic
center; Appendix B: Calculation of the geographical center of the
conterminous U.S.; References.
Barton R. Burkhalter: Equal-Area Venn Diagrams of Two Circles: Their
Use with Real-World Data
General problem; Definition of the two-circle problem; Analytic
strategy; Derivation of B% and AB% as a function of r(B) and d(AB).
Sandra L. Arlinghaus, William C. Arlinghaus, Frank Harary, John D.
Nystuen. Los Angeles, 1994 -- A Spatial Scientific Study.
Los Angeles, 1994; Policy implications; References; Tables and
complicated figures.
--------------------
Volume IV, No. 2, Winter, 1993.
William D. Drake, S. Pak, I. Tarwotjo, Muhilal, J. Gorstein, R. Tilden.
Villages in Transition: Elevated Risk of Micronutrient Deficiency.
Abstract; Moving from traditional to modern village life: risks
during transtion; Testing for elevated risks in transition villages;
Testing for risk overlap within the health sector; Conclusions and policy
implications
Volume IV, No. 1, Summer, 1993.
Sandra L. Arlinghaus and Richard H. Zander: Electronic Journals:
Observations Based on Actual Trials, 1987-Present.
Abstract; Content issues; Production issues; Archival issues; References
John D. Nystuen: Wilderness As Place.
Visual paradoxes; Wilderness defined; Conflict or synthesis;
Wilderness as place; Suggested readings; Sources; Visual illusion authors.
Frank E. Barmore: The Earth Isn't Flat. And It Isn't Round Either:
Some Significant and Little Known Effects of the Earth's Ellipsoidal
Shape.
Abstract; Introduction; The Qibla problem; The geographic center;
The center of population; Appendix; References.
Sandra L. Arlinghaus: Micro-cell Hex-nets?
Introduction; Lattices: Microcell hex-nets; References
Sandra L. Arlinghaus, William C. Arlinghaus, Frank Harary:
Sum Graphs and Geographic Information.
Abstract; Sum graphs; Sum graph unification: construction;
Cartographic application of sum graph unification; Sum graph
unification: theory; Logarithmic sum graphs; Reversed sum graphs;
Augmented reversed logarithmic sum graphs; Cartographic application of
ARL sum graphs; Summary.
--------------------
Volume III, No. 2, Winter, 1992.
Frank Harary: What Are Mathematical Models and What Should They Be?
What are they?
Two worlds: abstract and empirical; Two worlds: two levels; Two
levels: derivation and selection; Research schema; Sketches of
discovery; What should they be?
Frank E. Barmore: Where Are We? Comments on the Concept of Center of
Population.
Introduction; Preliminary remarks; Census Bureau center of
population formulae; Census Bureau center of population description;
Agreement between description and formulae; Proposed definition of the
center of population; Summary; Appendix A; Appendix B; References.
Sandra L. Arlinghaus and John D. Nystuen: The Pelt of the Earth: An
Essay on Reactive Diffusion.
Pattern formation: global views; Pattern formation: local views;
References cited; Literature of apparent related interest.
Volume III, No. 1, Summer, 1992.
Harry L. Stern: Computing Areas of Regions with Discretely Defined
Boundaries.
Introduction; General formulation; The plane; The sphere; Numerical
examples and remarks; Appendix--Fortran program.
Sandra L. Arlinghaus, John D. Nystuen, Michael J. Woldenberg: The
Quadratic World of Kinematic Waves.
--------------------
Volume II, No. 2, Winter, 1991.
Reprint of Saunders Mac Lane: Proof, Truth, and Confusion, The Nora
and Edward Ryerson Lecture at The University of Chicago in 1982.
The fit of ideas; Truth and proof; Ideas and theorems; Sets and
functions; Confusion via surveys; Cost-benefit and regression;
Projection, extrapolation, and risk; Fuzzy sets and fuzzy thoughts;
Compromise is confusing.
Robert F. Austin: Digital Maps and Data Bases: Aesthetics versus
accuracy.
Introduction; Basic issues; Map production; Digital maps;
Computerized data bases; User community.
Volume II, No. 1, Summer, 1991.
Sandra L. Arlinghaus, David Barr, John D. Nystuen:
The Spatial Shadow: Light and Dark -- Whole and Part.
This account of some of the projects of sculptor David Barr attempts
to place them in a formal systematic, spatial setting based on the
postulates of the science of space of William Kingdon Clifford (reprinted
in Solstice, Vol. I, No. 1.).
Sandra L. Arlinghaus: Construction Zone--The Logistic Curve.
Educational feature--Lectures on Spatial Theory.
--------------------
Volume I, No. 2, Winter, 1990.
John D. Nystuen: A City of Strangers: Spatial Aspects of Alienation
in the Detroit Metropolitan Region.
This paper examines the urban shift from "people space" to "machine
space" (see R. Horvath, Geographical Review, April, 1974) in the Detroit
metropolitan regions of 1974. As with Clifford's Postulates, reprinted
in the last issue of Solstice, note the timely quality of many of the
observations.
Sandra Lach Arlinghaus: Scale and Dimension: Their Logical Harmony.
Linkage between scale and dimension is made using the Fallacy of
Division and the Fallacy of Composition in a fractal setting.
Sandra Lach Arlinghaus: Parallels Between Parallels.
The earth's sun introduces a symmetry in the perception of its
trajectory in the sky that naturally partitions the earth's surface into
zones of affine and hyperbolic geometry. The affine zones, with single
geometric parallels, are located north and south of the geographic
parallels. The hyperbolic zone, with multiple geometric parallels, is
located between the geographic tropical parallels. Evidence of this
geometric partition is suggested in the geographic environment--in the
design of houses and of gameboards.
Sandra L. Arlinghaus, William C. Arlinghaus, and John D. Nystuen: The
Hedetniemi Matrix Sum: A Real-world Application.
In a recent paper, we presented an algorithm for finding the
shortest distance between any two nodes in a network of n nodes when
given only distances between adjacent nodes (Arlinghaus, Arlinghaus,
Nystuen, Geographical Analysis, 1990). In that previous research, we
applied the algorithm to the generalized road network graph surrounding
San Francisco Bay. Here, we examine consequent changes in matrix entries
when the underlying adjacency pattern of the road network was altered by
the 1989 earthquake that closed the San Francisco--Oakland Bay Bridge.
Sandra Lach Arlinghaus: Fractal Geometry of Infinite Pixel
Sequences: "Super-definition" Resolution?
Comparison of space-filling qualities of square and hexagonal pixels.
Sandra Lach Arlinghaus: Construction Zone--Feigenbaum's number; a
triangular coordinatiztion of the Euclidean plane; A three-axis
coordinatization of the plane.
Volume I, No. 1, Summer, 1990.
Reprint of William Kingdon Clifford: Postulates of the Science of Space.
This reprint of a portion of Clifford's lectures to the Royal
Institution in the 1870s suggests many geographic topics of concern in
the last half of the twentieth century. Look for connections to boundary
issues, to scale problems, to self-similarity and fractals, and to
non-Euclidean geometries (from those based on denial of Euclid's parallel
postulate to those based on a sort of mechanical `polishing'). What else
did, or might, this classic essay foreshadow?
Sandra Lach Arlinghaus: Beyond the Fractal.
The fractal notion of self-similarity is useful for characterizing
change in scale; the reason fractals are effective in the geometry of
central place theory is because that geometry is hierarchical in nature.
Thus, a natural place to look for other connections of this sort is to
other geographical concepts that are also hierarchical. Within this
fractal context, this article examines the case of spatial diffusion.
When the idea of diffusion is extended to see "adopters" of an
innovation as "attractors" of new adopters, a Julia set is introduced as
a possible axis against which to measure one class of geographic
phenomena. Beyond the fractal context, fractal concepts, such as
"compression" and "space-filling" are considered in a broader
graph-theoretic setting.
William C. Arlinghaus: Groups, Graphs, and God.
Sandra L. Arlinghaus: Theorem Museum--Desargues's Two Triangle
Theorem from projective geometry.
Construction Zone--centrally symmetric hexagons.
------------------------------------------------------------------------