An electronic journal of geography and mathematics
Earth: with 23.5 degrees north latitude as the central parallel.
Volume XI
Number 1
June, 2000
2000
Volume XI, Number 1, 2000
Cover
Front matter: Summer, 2000
Editorial
Board, Advice to Authors, Mission Statement.
John D. Nystuen
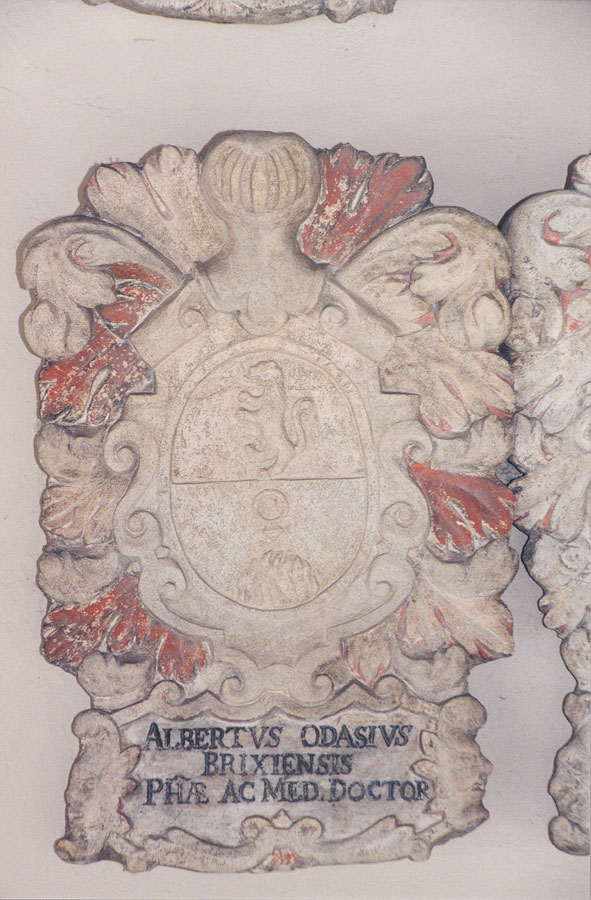
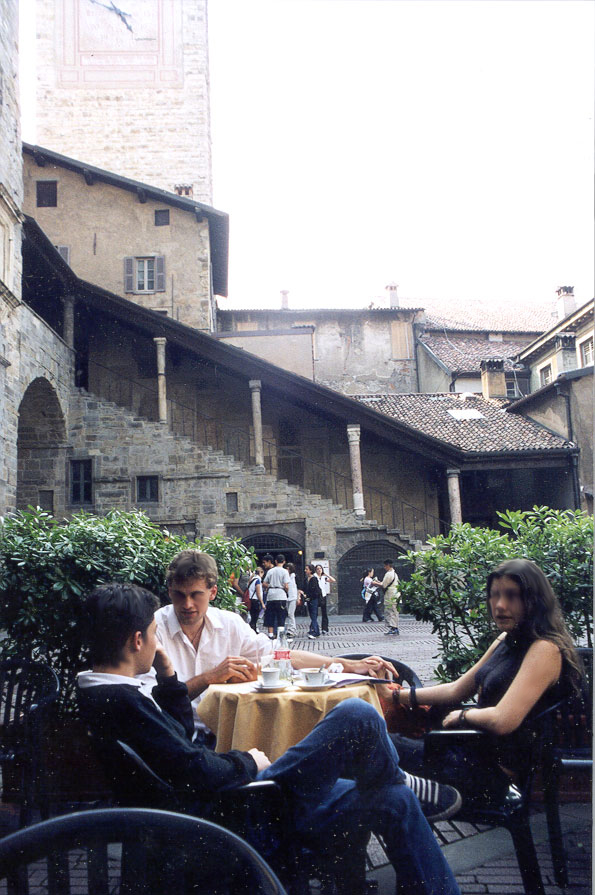
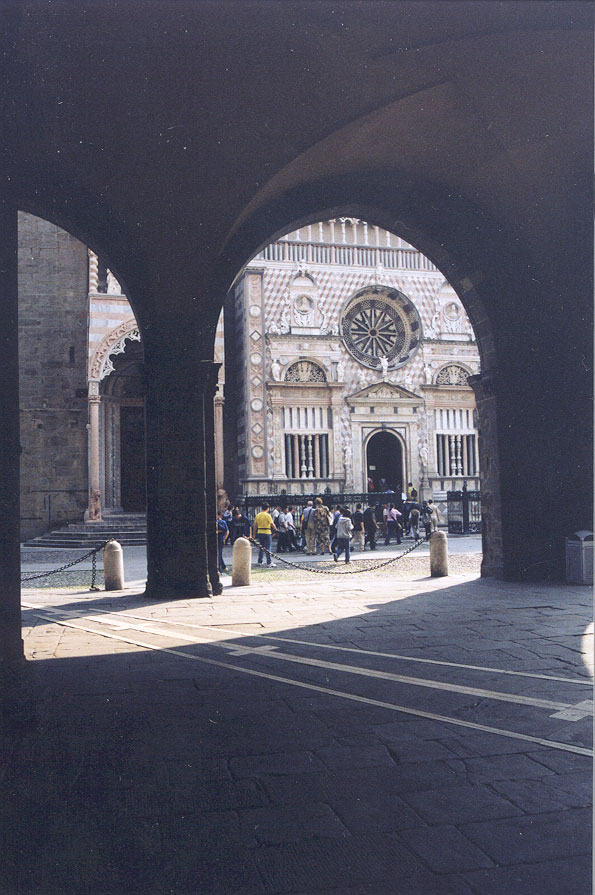
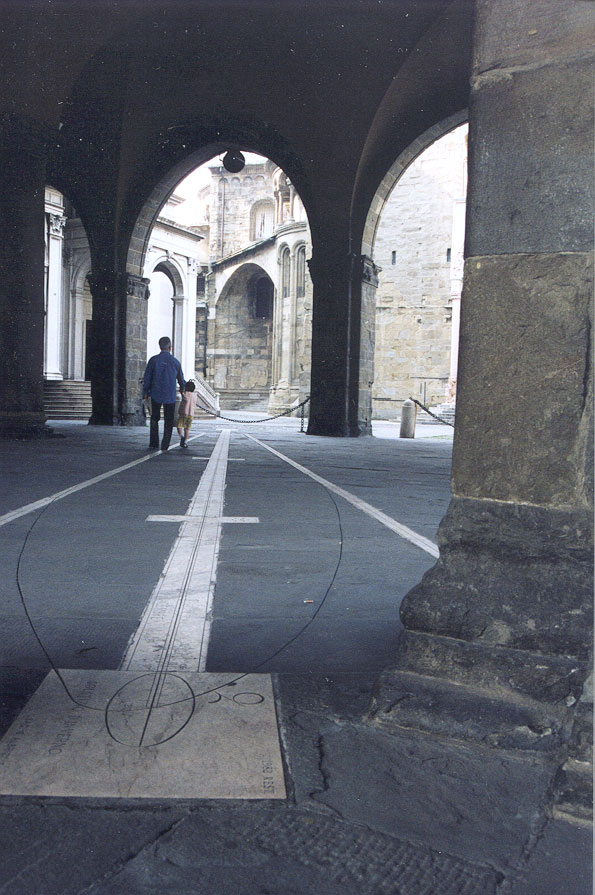
Set
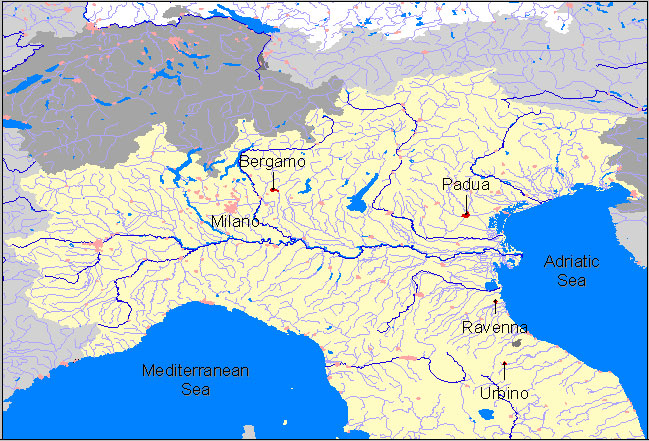
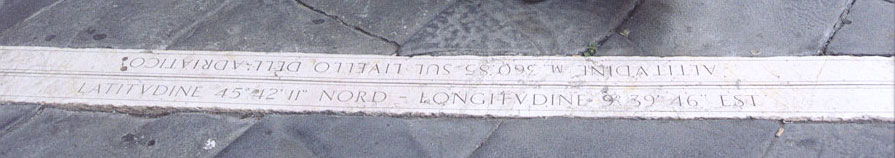
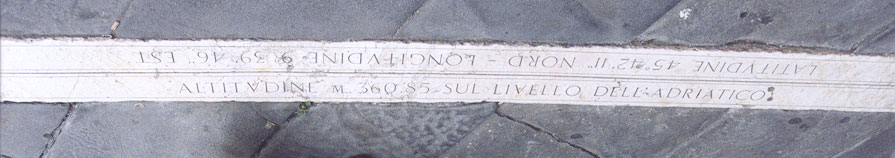
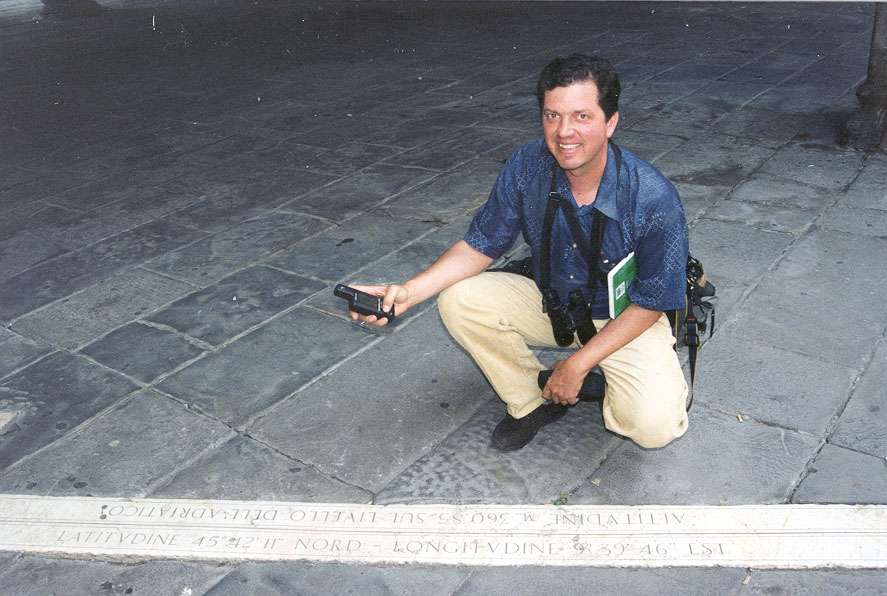
in Stone: An Analemma in Northern Italy
Richard Wallace
Personal
Reflections on Solar Power
Sandra Lach Arlinghaus
Animaps,
IV: Of Time and Place
On a slow modem this
article
will take a long time to load.
Book
Review.
Review of: Arundhati Roy, The Cost of Living, Modern
Library,
1999, 126 pp., $11.95 (pap.).
Reviewer: Richard Wallace.
SOLSTICE:  AN ELECTRONIC JOURNAL OF GEOGRAPHY AND MATHEMATICS

http://www.imagenet.org

SUMMER, 2000

VOLUME XI, NUMBER 1

ANN ARBOR, MICHIGAN


Founding Editor-in-Chief:
     Sandra Lach Arlinghaus, University of Michigan;
        Institute of Mathematical Geography (independent)

Editorial Advisory Board:
  Geography.
     Michael F. Goodchild, University of California, Santa Barbara
     Daniel A. Griffith, Syracuse University
     Jonathan D. Mayer, University of Washington (also School of Medicine)
     John D. Nystuen, University of Michigan
  Mathematics.
     William C. Arlinghaus, Lawrence Technological University
     Neal Brand, University of North Texas
     Kenneth H. Rosen, A. T. & T. Bell Laboratories
  Engineering Applications.
     William D. Drake, University of Michigan
  Education.
     Frederick L. Goodman, University of Michigan
  Business.
     Robert F. Austin, Austin Communications Education Services.

Book Review Editors:
     Richard Wallace, University of Michigan.
     Kameshwari Pothukuchi, Wayne State University

Web Design:
     Sandra L. Arlinghaus
     (with early input from William E. Arlinghaus).

WebSite:  http://www.imagenet.org

Electronic address:  sarhaus@umich.edu


MISSION STATEMENT

     The purpose of Solstice is to promote interaction between geography
and mathematics. Articles in which elements of one discipline are used to
shed light on the other are particularly sought.  Also welcome are
original contributions that are purely geographical or purely
mathematical.  These may be prefaced (by editor or author) with commentary
suggesting directions that might lead toward the desired interactions.
Individuals wishing to submit articles or other material should contact an
editor, or send e-mail directly to sarhaus@umich.edu.


SOLSTICE ARCHIVES

     Back issues of Solstice are available on the WebSite of the Institute
of Mathematical Geography, http://www.imagenet.org and at various sites
that can be found by searching under "Solstice" on the World Wide Web.
Thanks to Bruce Long (Arizona State University, Department of Mathematics)
for taking an early initiative in archiving Solstice using GOPHER.


PUBLICATION INFORMATION

     The electronic files are issued yearly as copyrighted hardcopy in the
Monograph Series of the Institute of Mathematical Geography.  This
material will appear in a Volume in that series, ISBN to be announced.
To order hardcopy, and to obtain current price lists, write to the
Editor-in-Chief of Solstice at 1964 Boulder Drive, Ann Arbor, MI 48104, or
call 734-975-0246.

     Suggested form for citation:  cite the hardcopy.  To cite the
electronic copy, note the exact time of transmission from Ann Arbor, and
cite all the transmission matter as facts of publication.  Any copy that
does not superimpose precisely upon the original as transmitted from Ann
Arbor should be presumed to be an altered, bogus copy of Solstice.  The
oriental rug, with errors, serves as the model for creating this weaving
of words and graphics.
Related
articles on the IMaGe website:
The Spatial Shadow: Light and Dark--Whole and Part
Analogue Clocks (pp. 71-87)
|
An Analemma in Northern Italy. The University of Michigan
|
Related articles from the
internet:
Sundials
on the internet
Equation
of Time
 |
Related
articles on the IMaGe website:
Motor Vehicle Transport and Global Climate Change: Policy Scenarios The Photographic Record. SunSweep: A Visit on the Summer Solstice The Spatial Shadow: Light and Dark--Whole and Part Personal Reflections on Solar Power The University of Michigan
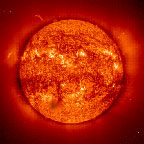
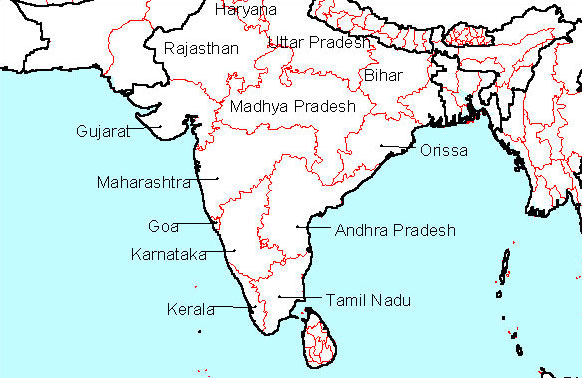
By my calculations, on May 16, 2000, with the summer solstice fast approaching, the sun should have been directly overhead at noon roughly somewhere near where I stood in south Goa. The linked photograph shows the author�s wife, Kami Pothukuchi, on the beach in Goa, approximately 74 degrees east longitude, 15 degrees north latitude. Consider the pattern of shadow in that photograph. Prior to this past May, I had never experienced the sun directly overhead, nor had I traveled to India, my wife�s home country. Thus, during my stay in India, I could not help but contemplate the sun and its byproducts and how they affected life in India. Appropriately, the sun and its effects played a central role in our trip. Even before our departure from Ann Arbor, my wife and I regularly checked the weather reports for Mumbai and Chennai in order to gauge just how hot it might be there during our stay. We arrived in Mumbai around midnight on May 7, but the heat and humidity still were intense, especially with the monsoons only about one month off. From then on, every day required consideration of the sun and the deleterious effects it might have on my pale skin: dressing properly, finding shade, applying sunscreen, obtaining safe drinking water, and timing trips to avoid the worst heat of the day, if at all possible. (Linked photo shows the author, looking weary of the sun, in Mumbai. The street is not named for the author.) Indirect products of the sun, too, were much in evidence during this trip. Fossil-fuel powered vehicles (note traffic in linked photo) are becoming increasingly common in India, for example, and they have begun to cause severe pollution effects. Even in the hill station resort of Ooty, surrounded by tea plantations, diesel exhaust proved omnipresent. Like Mexico City, Ooty is nestled in a mountain valley. Therefore, the exhaust produced by the countless tour buses, motor scooters, and power boats that ply the narrow mountain roads and mountain lakes settles in and stays the night, just like the tourists. Indeed, by my nasal meter, air quality in Ooty was worse than what we encountered in Mumbai. Plastics, too, the polymerized end-products of eons of photosynthetic activity, have found their way into the Indian environment. Everywhere we went plastic bags and bottles littered the countryside. Apparently, the Indian system of creative reuse and recycling of all waste products has yet to devise a system for keeping up with the supply of discarded plastic. Let�s not forget about the rain. The monsoons, terrific storms powered by the intense summer sun heating the land far in excess of the sea, were due shortly after our scheduled departure for the U.S. As luck would have it, however, our return to Mumbai from greeting the sun in Goa was met with the worst pre-monsoon rains in 50 years�rains so intense that they shut-down the trains and buses and even dislodged a seemingly endless series of stories dedicated to gambling scandals in cricket and the Miss Universe Pageant (an Indian won yet again�could the sun have played a role here, too?) from the front page of The Times of India. Today (summer solstice, June 21, 2000), the sun begins heading south again, headed toward the Tropic of Capricorn for about the ten billionth time. As it does so, it will pass over much of a nation that is increasingly a leader in high technology, albeit while still having most of its one billion people mired in deep poverty. Now that I am back in the US, avoiding use of my car and recycling all of my plastic, I am hopeful that India will devote some of its newfound high-tech expertise toward improved use of our shared solar resources. Perhaps, for example, an Indian engineer will develop a solar-powered car, or at least one that runs cleanly off all those empty plastic water bottles that I left behind. |
Source of sand image: cropped from the author's photograph of a beach in southern Goa.
 |
Related articles
on the IMaGe
website:
Animaps The University of Michigan
"The
people
along the sand
All turn and look one way; They turn their backs on the land They look at the sea all day. They cannot look
out far,
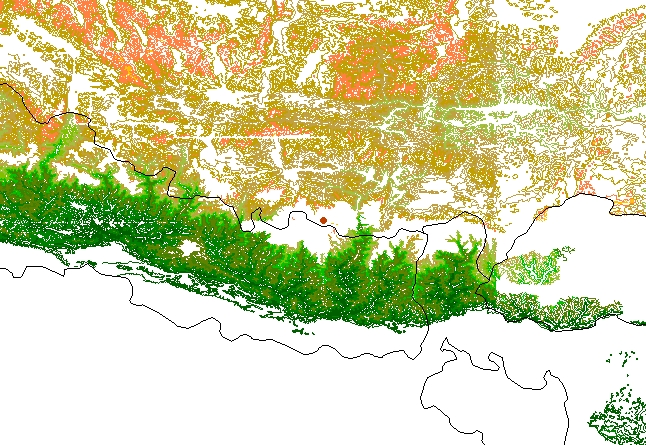
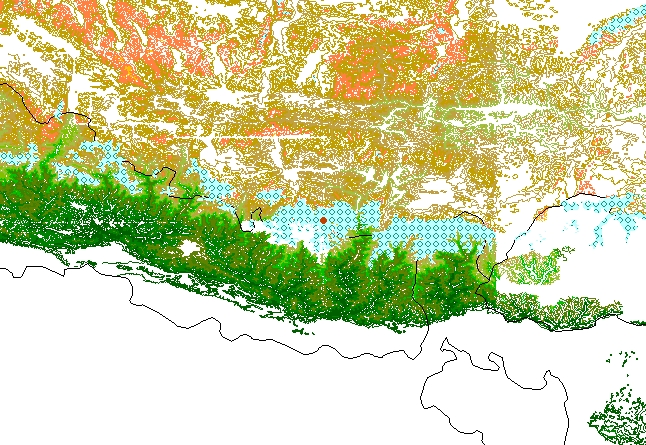
Robert Frost, Neither out far nor in deep. Animated maps offer exciting possibilities for tracking spatial change over time. In earlier work in this journal (see links above), animated maps (or "animaps") were used to track changes, across the globe, in bee mite population over time. They were also used as analytic tools that could employ surrogate variables to mimic change over time in variables that were difficult to learn about. The introduction of time, through animation, into the mapping process allows the user to participate "with" the map in more than a purely passive manner; two examples are offered below that allow the reader some degree of interaction with the process. In the first, the reader experiences emotional involvement only and a downloadable interaction, only; in the second the reader can actually drag elements of the map around on the screen, as an instantaneous interaction achieved directly through the browser. Mapplets. Thus, the "Mapplet" below offers a different perspective on the varroa mite data set. That data set shows easily that there is one country reporting the mite in 1904; in 1912 there is a siting in one other country. This sort of sporadic siting, one country at a time, occurs until 1963. Post-1963 there are multiple countries that come in on a yearly basis: sometimes 3 new additions, sometimes 7 new additions. The pattern of new receptors may show cycles; indeed, experts on the mites might reflect on whether or not the graphical pattern on number of new countries by year corresponds in any way to various biological cycles associated with the mite or its host. If it does, then choke-points in the pattern offer possible timing opportunities to intervene (Arlinghaus and Nystuen). If it does not, then one might consider the extent to which there is cyclical pattern in reporting error or in shipping (http://www.agric.wa.gov.au:7000/ento/bee.htm)and travel patterns. A glance at the maps suggests that those who live in as yet unaffected regions might find such observations of particular interest. In the Mapplet below, the pattern of reported sitings from multiple national sources starts just after 1963: hence, the red color of 1963, as the pattern initiator. The next siting of the mites occurred in 1967, in four different countries: hence the entries of 67a, 67b, 67c, and 67d. In 1968 there were also four sitings; thus, another four boxes, 68a, 68b, 68c, 68d. The 1963 box is joined to each of 67a, 67b, 67c, and 67d using a length of line segment four times as long as the lengths from each of 67a, 67b, 67c, and 67d to each of 68a, 68b, 68c, and 68d. Variation in time between sitings is represented by varying the length of line joining them. All sitings in year X are joined to all sitings in year X+1 (or the next year in which sitings occurred). The rationale for joining all from one year to all in the next year is that one does not know how the diffusion is taking place. What is interesting here, perhaps, is that even when there are years with relatively large numbers of countries reporting sitings, still the pattern settles back to a small number eventually even though one might expect it simply to spread even more. Two obvious directions to interpret this involve reporting error or some sort of saturation of the diffusion, perhaps related to forces such as human travel patterns or mite biology, that are outside the simple mechanics of diffusion (Hagerstrand). The Mapplet can suggest directions for research questions. |

Mapplet: Structural model of varroa mite
diffusion
through time. Pull the red year-box for 1963 all the way
across
to the right (use the scroll bar) and then drag and drop various pieces
of the left side of the mapplet to unravel it and see the pattern of
possible
time points of opportunity at various stages in the diffusion
process.
If a box "sticks" on another, pull it in a bit of a different
direction.
Generally it is possible to move beyond the obstacle. Mapplets
seem
to offer a wide array of possibilities for description, interpretation,
and analysis of complex spatial systems.
|
References.
|
| BOOK REVIEW
Arundhati Roy, The Cost of Living, Modern Library, 1999, 126 pp., $11.95 (pap.). During a recent trip to India, my first, I was struck by the imposition of technology into the culture, despite the widespread poverty. Everywhere one turned, billboards touted the latest dot com or advertised training in C++ or Perl. Inevitably, however, below the billboards one would find sidewalk dwellers or streethawkers, none of whom could ever fancy a computer purchase. The newspapers, too, were awash in high-tech advertisements (and cricket scandals and beauty pageants), while news about the majority of Indians impoverished and free of computers was nearly non-existent. Clearly, the papers reflected the lives of the middle class. What of everyone else? In The Cost of Living, Arundhati Roy raises her voice on behalf of those who pay the price for the advancement of others. In this slim volume, Roy brings together two controversial essays that were previously published in general interest magazines (Outlook and Frontline). In these essays, the Booker-Prize winning author of The God of Small Things directs her considerable written skills against two sacred cows of Indian governmental policy: dams and nuclear weapons. Both essays are polemics; yet, they raise important issues and deserve serious attention from activists, policymakers, and scholars. Although written by the same author, the two essays in the volume may appear at first glance to be otherwise unrelated. Upon exploring the book, however, at least two unifying themes emerge. First, both essays raise serious concerns about human efforts to employ technologies that, whatever their perceived benefits, threaten human and natural systems on a large scale. In Roy's view, both large dams and nuclear bombs put human society at war with the natural environment. Second, these essays discuss the often-unexamined costs of technological development and find that not only do all segments of society not benefit from technology, but also that many pay dearly for what is achieved. Third, both ask fundamental questions about democracy, patriotism, and citizenship. The first essay in the book ('For the Greater Common Good') makes an impassioned plea against completion of the Sardar Sarovar Dam on the Narmada River. This river, the fifth longest in India, traverses portions of Madhya Pradesh and Maharashtra before winding through the drought-prone state of Gujarat for most of its course. Originally planned in the time of Nehru, and backed by an international coalition of development interests (the World Bank, Western consultants, Japanese contractors, Indian politicians, and so forth), the Sardar Sarovar Dam threatens the homes of some 40,000 families. Opposed by environmentalists in India and abroad just this month (June 2000) a protest of the dam is scheduled for New York City as well as local activists among the affected residents, the dam, partially constructed and way over projected costs, appears to the author as an epic battle for the soul of the nation. Will India be a nation that cares about the state of its natural environment and the welfare of its least privileged citizens or not? Trained as an architect, Roy brings more than the novelist's skill as a wordsmith to her task. Rather, she meticulously analyzes the promises made by dam proponents and finds their claims of benefits (irrigation, drinking water, and others) to lack credibility. For example, she finds past Indian dam projects have quickly led to waterlogged soil and soil salinization. Second, she details a cycle of debt-creation imposed on developing nations by large projects funded by foreign loans. Third, she examines government plans for Project Affected Persons (the government's official term for those living in the area that will be flooded by the dam) many of them Adivasis, the original inhabitants of India, most of whom live in dire poverty and finds these plans inadequate. Worst of all, she finds that non-landowners, including many of the Adivasis, are scheduled to receive no compensation at all for being displaced. All told, she questions the scientific economic, environmental, and moral bases of the project. By extension, she raises serious doubts about the efficacy and equity of all large dam projects, be they in the developing world or elsewhere. No doubt, many readers will question her analysis, or at least wonder about its accuracy. For these readers, she offers detailed footnotes of her sources allowing interested readers to perform their own analyses and draw their own conclusions. Furthermore, readers can balance Roy's polemic by visiting the dam's own web site (www.sardarsarovar.com) for an opposing view. Ultimately, despite her impassioned plea in opposition to the dam and its related projects (including numerous additional dams on the Narmada River system), she accepts that some will disagree with her and insist on building the dam, regardless of the costs. These forces may even win (and are winning as this review goes to print). That understood, Roy makes one request of dam supporters and opponents alike: Whether you love the dam or hate it, whether you want it or you don't, it is in the fitness of things that you understand the price that's being paid for it. That you have the courage to watch while the dues are cleared and the books are squared.The second, and briefer, essay in the book, 'The End of Imagination,' presents a voice of dissent against the general domestic jubilation that accompanied India's first successful nuclear bomb test. In so doing, Roy questions the validity of the theory of deterrence and laments the loss of the moral high ground that building bombs implies. In her words, a better position would have been: "we have the technology, we can make bombs if we want to, but we won't. We don't believe in them." For good measure, she also takes a shot at fundamentalism of all flavors and questions popular portrayals of what it means to be an authentic Indian. In sum, this essay makes a case for nuclear non-proliferation for India regardless of what other nations are doing. The bomb itself, and its potential destruction, she argues, is sufficient reason for not building any. Together, the two essays in The Cost of Living present a significant challenge to new and old democracies alike. Is it enough to argue for the greater common good, when the same group of people is asked to pay the costs over and over? Can democracy truly be maintained in a nuclear weapons state? Such questions have yet to be answered anywhere definitively. If nothing else, The Cost of Living invites all to enter the debate. Richard Wallace, Ph.D.
Candidate,
|