An electronic journal of geography and mathematics

Earth: with 23.5 degrees south latitude as the central parallel.
Volume XI
Number 2
december, 2000
Volume XI, Number 2, 2000
Cover
Front matter: Winter, 2000
Editorial
Board, Advice to Authors, Mission Statement.
To the Memory of Donald Frederick Lach, 1917-2000
Dedication
John D. Nystuen, Photo Essay
Fifty
Years of Spatial Analysis: A Symposium in Honor of William L.
Garrison
1950-2000
(High-speed
connection
recommended.)
Sandra L. Arlinghaus and Lloyd R. Phillips
A
Neighborhood Information System within Ann Arbor, Michigan
Courtney Gober
Animaps,
Again
Nakia D. Baird
Animap
Sequences
(High-speed connection
recommended)
SOLSTICE:  AN ELECTRONIC JOURNAL OF GEOGRAPHY AND MATHEMATICS

http://www.imagenet.org

WINTER, 2000

VOLUME XI, NUMBER 2

ANN ARBOR, MICHIGAN


Founding Editor-in-Chief:
     Sandra Lach Arlinghaus, University of Michigan;
        Institute of Mathematical Geography (independent)

Editorial Advisory Board:
  Geography.
     Michael F. Goodchild, University of California, Santa Barbara
     Daniel A. Griffith, Syracuse University
     Jonathan D. Mayer, University of Washington (also School of Medicine)
     John D. Nystuen, University of Michigan
  Mathematics.
     William C. Arlinghaus, Lawrence Technological University
     Neal Brand, University of North Texas
     Kenneth H. Rosen, A. T. & T. Bell Laboratories
  Engineering Applications.
     William D. Drake, University of Michigan
  Education.
     Frederick L. Goodman, University of Michigan
  Business.
     Robert F. Austin, Austin Communications Education Services.

Book Review Editors:
     Richard Wallace, University of Michigan.
     Kameshwari Pothukuchi, Wayne State University

Web Design:
     Sandra L. Arlinghaus
     (with early input from William E. Arlinghaus).

WebSite:  http://www.imagenet.org

Electronic address:  sarhaus@umich.edu


MISSION STATEMENT

     The purpose of Solstice is to promote interaction between geography
and mathematics. Articles in which elements of one discipline are used to
shed light on the other are particularly sought.  Also welcome are
original contributions that are purely geographical or purely
mathematical.  These may be prefaced (by editor or author) with commentary
suggesting directions that might lead toward the desired interactions.
Individuals wishing to submit articles or other material should contact an
editor, or send e-mail directly to sarhaus@umich.edu.


SOLSTICE ARCHIVES

     Back issues of Solstice are available on the WebSite of the Institute
of Mathematical Geography, http://www.imagenet.org and at various sites
that can be found by searching under "Solstice" on the World Wide Web.
Thanks to Bruce Long (Arizona State University, Department of Mathematics)
for taking an early initiative in archiving Solstice using GOPHER.


PUBLICATION INFORMATION

     The electronic files are issued yearly as copyrighted hardcopy in the
Monograph Series of the Institute of Mathematical Geography.  This
material will appear in a Volume in that series, ISBN to be announced.
To order hardcopy, and to obtain current price lists, write to the
Editor-in-Chief of Solstice at 1964 Boulder Drive, Ann Arbor, MI 48104, or
call 734-975-0246.

     Suggested form for citation:  cite the hardcopy.  To cite the
electronic copy, note the exact time of transmission from Ann Arbor, and
cite all the transmission matter as facts of publication.  Any copy that
does not superimpose precisely upon the original as transmitted from Ann
Arbor should be presumed to be an altered, bogus copy of Solstice.  The
oriental rug, with errors, serves as the model for creating this weaving
of words and graphics.
|
Donald Frederick Lach September 24, 1917 - October 26, 2000 Bernadotte
E. Schmitt Professor Emeritus
Author:
Asia
in the Making of Europe,
|

Scanned floral image by Alma S. Lach. Real flower from the rose garden of the Quadrangle Club, donated by Nicholas Fulop. |
A SYMPOSIUM IN HONOR OF WILLIAM L. GARRISON,
1950-2000
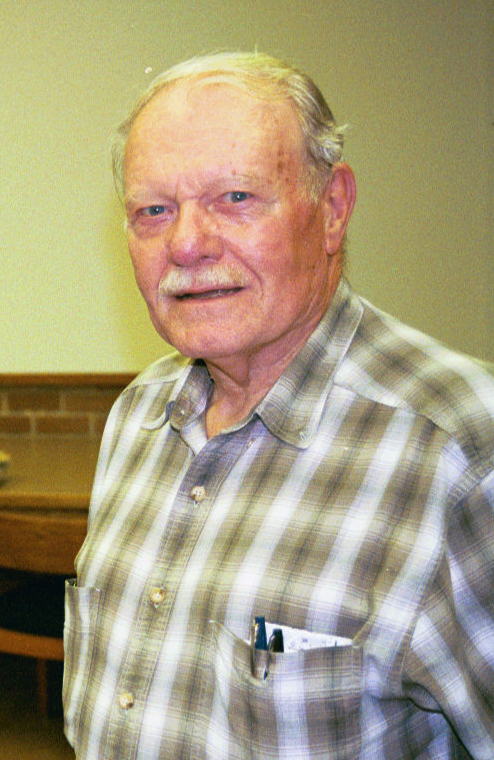
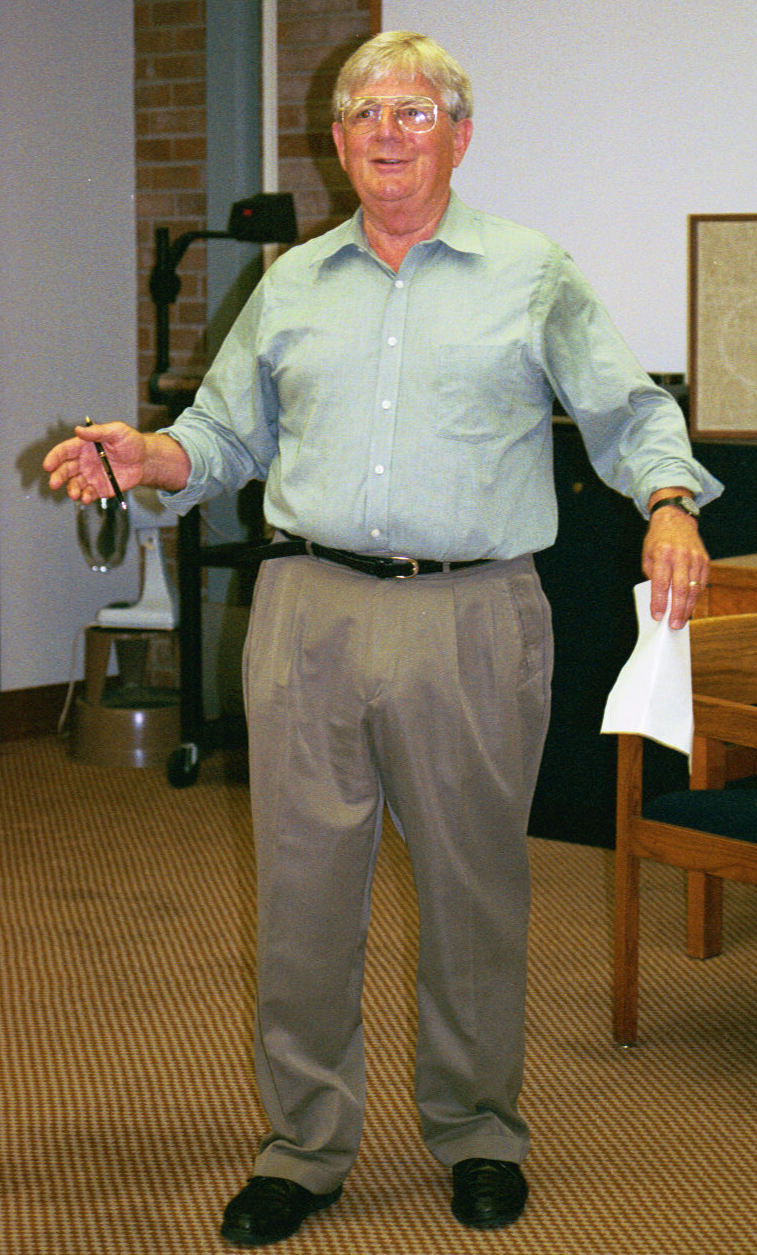
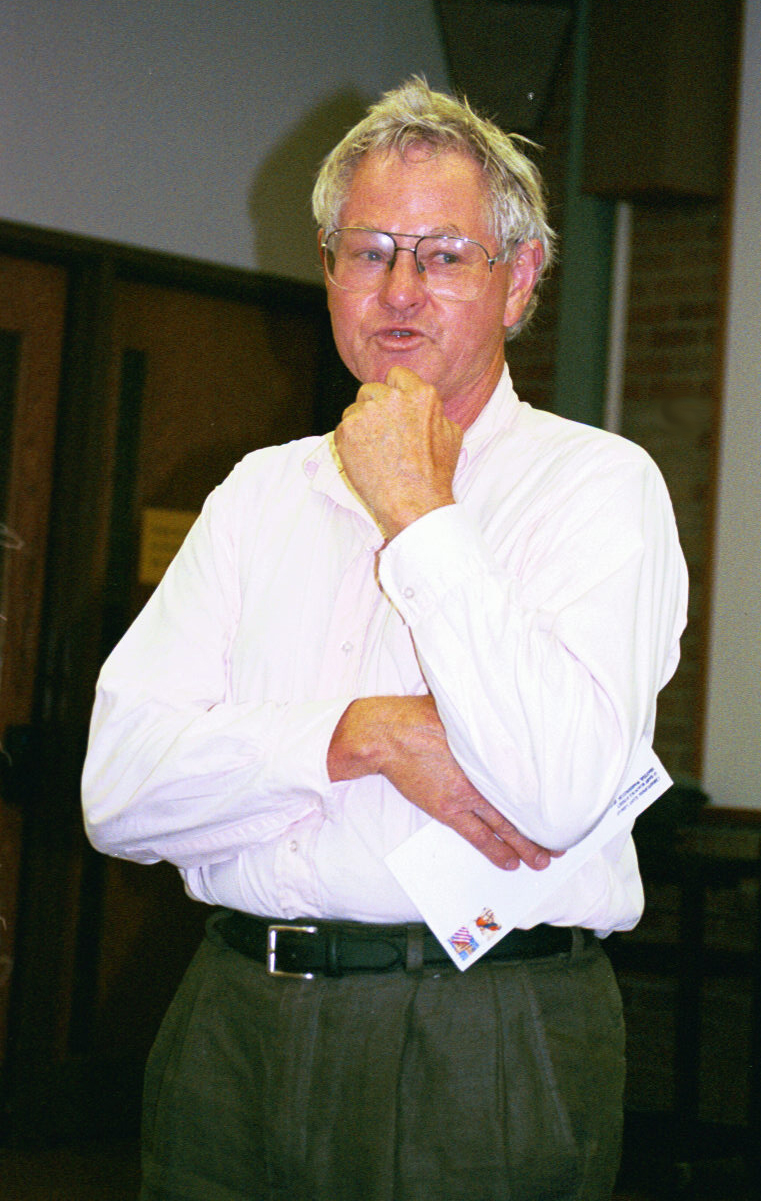
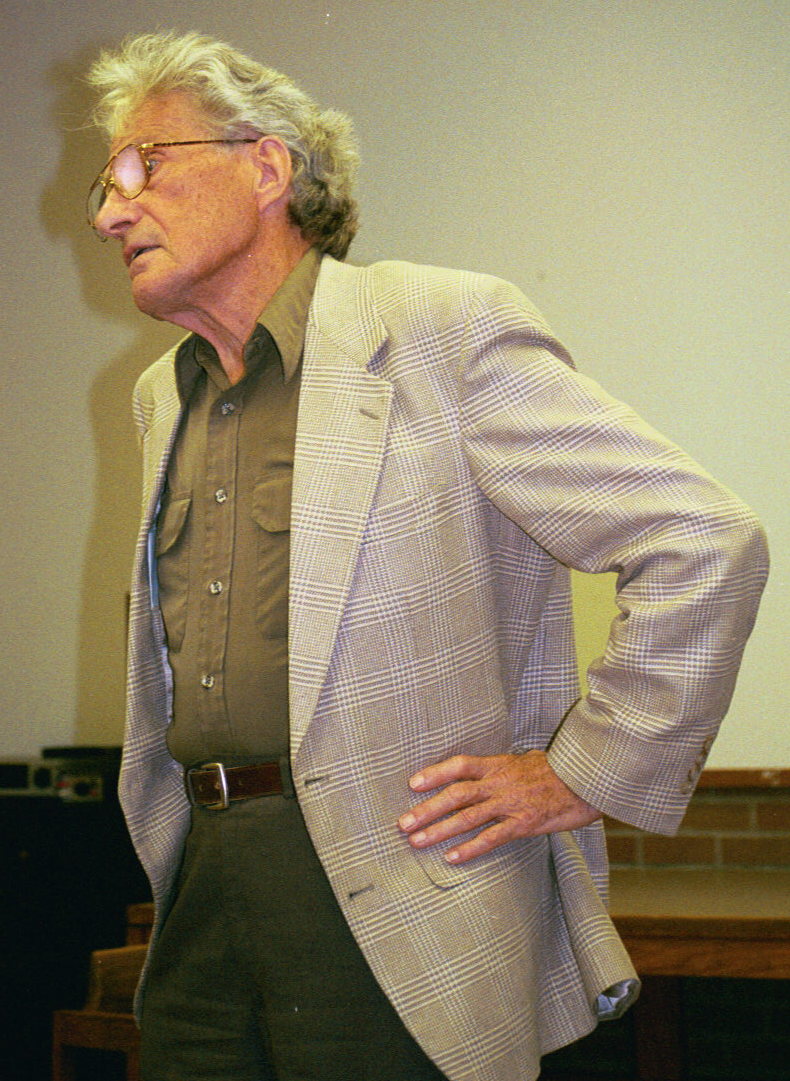
PHOTO ESSAY BY JOHN D. NYSTUEN
Brian J. L. Berry (right) presents plaque to William L. Garrison (left) commemorating the award of his Ph.D. from Northwestern University in 1950.
 |
 |
Text of plaque
|
Presented to William L. Garrison In Appreciation of Fifty Years of Inspirational Leadership to the Geographical and Transportation Sciences With Respect and Appreciation The Space Cadets 2000 |
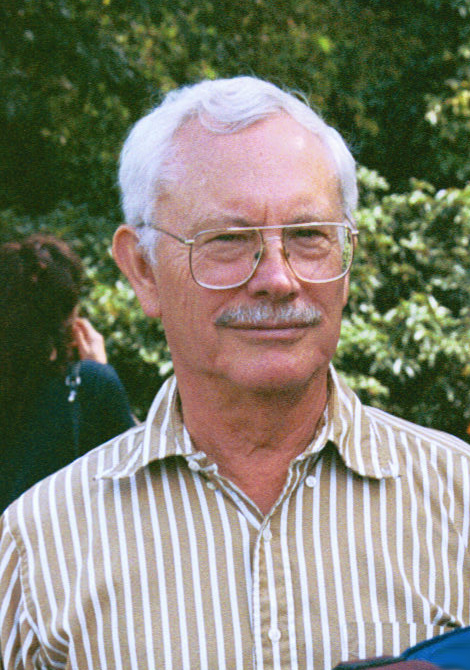
Professor Garrison's Ph.D. students at the University of Washington (1958-1961), as they appeared Friday, September 15, 2000 (not arranged in chronological order, but in a pattern that is visually appealing to the author).
 |
 |
 |
 |
Richard L. Morrill (Ph.D. 1959), University of Washington, Professor Emeritus.
Waldo R. Tobler (Ph.D. 1961), University of California, Santa Barbara, Professor Emeritus
Michael F. Dacey (Ph.D. 1960), Northwestern University, Professor and Associate Dean.
Brian J. L. Berry (Ph.D. 1958), University of Texas, Professor.
 |
 |
 |
 |
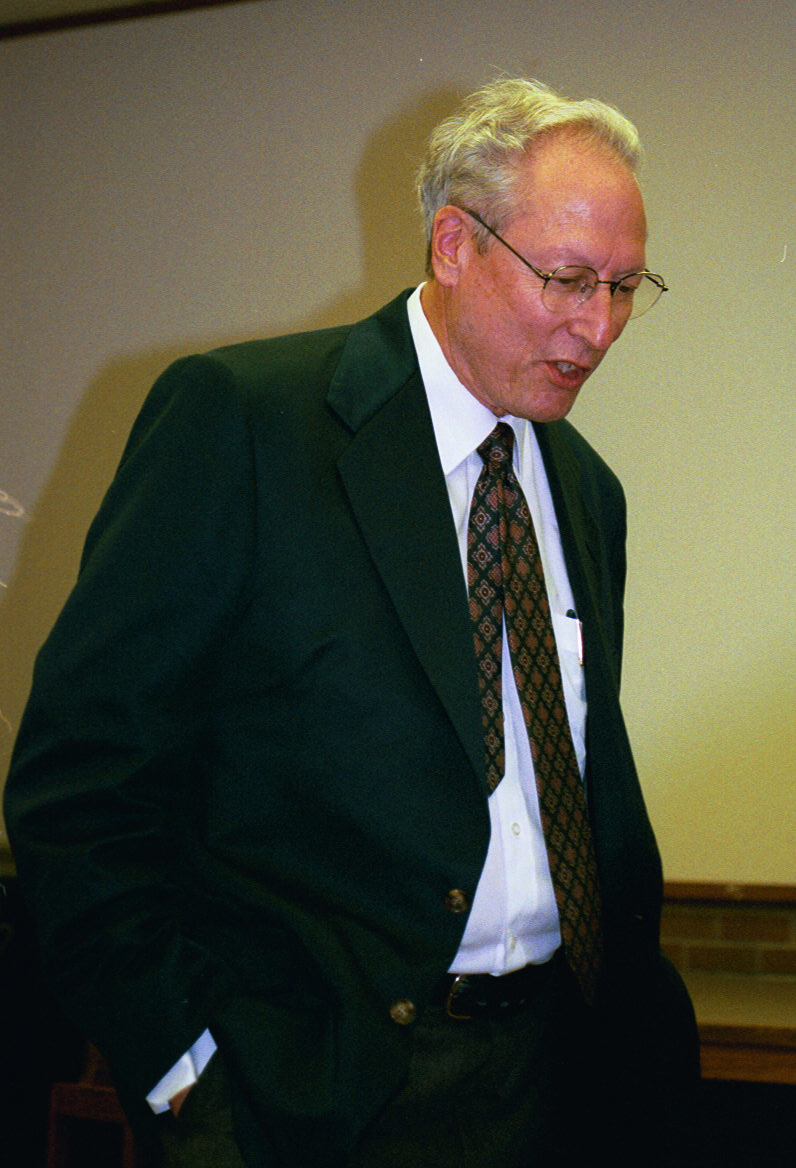
Arthur Getis (Ph.D. 1961), San Diego State University, ProfessorNot shown: William W. Bunge (Ph.D. c.1961), Arthabaska, Quebec.
John D. Nystuen (Ph.D. 1959), The University of Michigan, Professor Emeritus
David L. Huff (Ph.D. 1960), University of Texas, Professor
Duane F. Marble (Ph.D. 1959), Ohio State University, Professor Emeritus
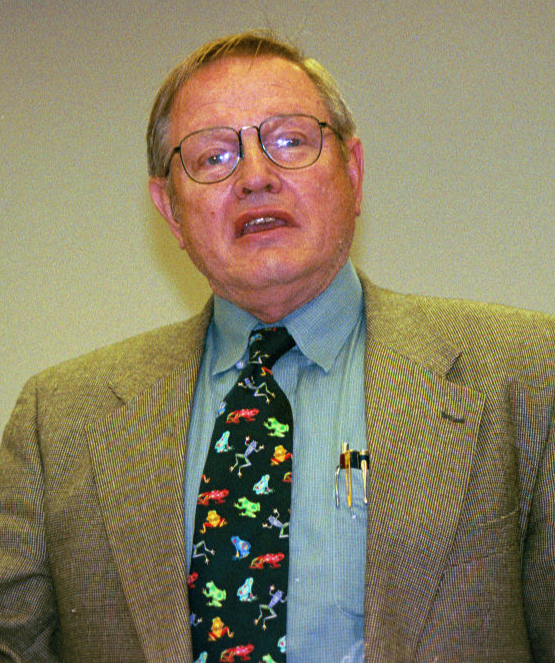
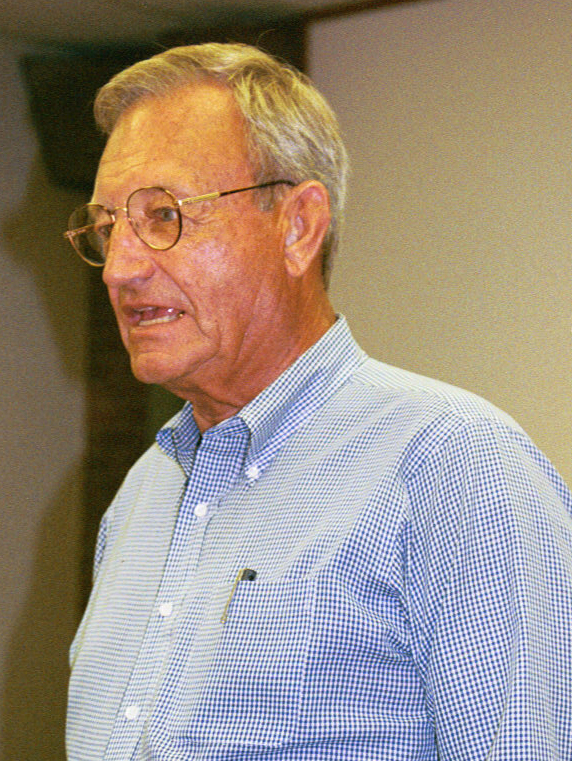
Other speakers photographed:
 |
 |
 |
 |
Forrest R. Pitts (Ph.D. Michigan, 1955), University of Hawaii, Professor Emeritus
Julian V. Minghi (Ph.D. Washington, 1962), University of South Carolina, Professor
William B. Beyers (Ph.D. Washington, 1967), University of Washington, Professor
Leslie Curry (Ph.D. New Zealand, 1959), University of Toronto, Professor Emeritus
Other pictures
On the campus
At the talks
On the boat
A Neighborhood Information System within Ann Arbor, Michigan
Link to zipped file containing this article. Unzip it and click on bromley1ndex.html to launch the file in your internet browser.
Courtney Gober
The University of Michigan
Student, Master of Art and Certificate Program in the Graduate Division of
The School of Education
An earlier article in Solstice
constructed an Animated Map, "Animap," from current data to suggest
pattern
that might exist if actual data were available. To quote from
that
article:
Sometimes it is difficult to acquire data over a period of time. With a bit of imagination, one may instead be able to use a surrogate variable to capture easily what might otherwise have been difficult to capture. To illustrate this sort of technique, in a time-dependent framework, consider the following animap. When African-Americans first came to North America, they entered often along the south and southeastern shores of modern-day U.S.A. Over time, population migrated and moved throughout the country. If one considers as a surrogate to having year by year data for that movement, the fact that not many people move over time all that far from their point of entry to the country, then one might capture the temporal movement pattern over centuries by the spatial density pattern at a single time slice. To test this idea from the standpoint of simple mapping, the U.S. was mapped by county according to density of African-American population (1990 Census data) (S. Arlinghaus and A. Laug). The mapping of this initial test-run was kept simple: the default lat/long framework, rather than a conventional projection, were used in the GIS (Atlas GIS, version 3.03) for eventual ease in switching to other projections. As had Nystuen, Laug wished to color percentages from previous frames all in one color, with percentages in the current frame colored in a different set of colors. She also wanted to track the advancing edge, as had Nystuen, but in addition wanted to see gradations in that edge. There is a tradeoff in clarity; how many categories should one use on the edge?In this article, the map from the previous article is recast using an Albers projection, and the edge gradations are removed in favor of a single edge color. Thus, counties shaded burgundy are ones for which the density has been measured. The edge counties colored yellow are those introduced at that particular time frame. Those left as white have not yet entered the picture.
 |
As in the previous
case the counties with highest percentage African American
populations
(as measured in 1990 Census data) enter the map first. The manner
in which they do so is reminiscent of actual migration patterns.
The premise is that people, even over a substantial time interval, do
not,
as large groups, move quickly from their original ports of entry.
Does this idea extend to other ethnic groups? The maps below show
the same analysis applied to 1990 Census data for percentage Hispanic
and
percentage Asian populations by county.
 |
The Hispanic Animap also suggests a pattern of diffusion that
reflects
(but does not exactly replicate) reality. The heavy early
populations
are along the U.S. Mexico border, followed by Florida and large cities
in the northeast and midwest. One issue with creating animaps is
to decide when to stop the process; otherwise, the whole nation will
eventually
become burgundy. There is a tradeoff in process and meaning.
 |
The case of the Asian Animap is a bit different. In the early frames, one sees the "expected" pattern with high densities on the west coast. In the next stage, one sees high densities enter in large cities across the nation, and, at the same time, high densities in what appear to be counties far removed from the largest cities. When those "unexpected" counties are checked, all contained large (mostly public) universities. In the case of the Asian population, the American university system appeared as a measurable agent fostering diffusion of population, even in this simulation.
How nice it is to have an easy-to-use strategy to capture movement general movement patterns. It would have been a monumental task to gather data on a county by county basis, from the first entry, for each of these populations. Instead, use of a well-chosen surrogate variable permitted creation of animated maps in a matter of a few hours.
Nakia D. Baird
The University of Michigan
Student, Master of Art and Certificate Program in the Graduate Division of
The School of Education
An earlier article in Solstice examined the merits of an animated sequence of Triangulated Irregular Networks (TINs) to introduce an element of order into complicated pattern. In that earlier map (takes time to load on a slow modem), the time distance between successive frames was constant (12/100 of a second between successive frames in the set of 50 frames "in" and 50 frames "out"). Views such as this offer a way to clarify geographic ideas. They might also be used, however, to make mathematical concepts come alive.
It is this latter idea that is examined here. When a constant
interval is chosen between successive animation frames, a linear
equation
is portrayed: in this case, for ease in generalization, suppose
y=10x
--- the time-spacing between successive frames ("in" only) is 10/100 of
a second. The left column in the table below shows half of the
map
from the previous article along with the graph it might be viewed to
represent.
Unit changes in x values produce a constant difference between
corresponding
y values: the viewer is set down on Earth at an apparently
uniform
rate.

Source of original map |

Source of original map: |
y=10x
 |
 |
Suppose instead of using y=10x, one "mapped" y=log10 x. The results would appear as in the right hand column of the table above. As values of x get larger, the successive differences between the corresponding values of y get smaller. Hence, the viewer is "smashed" more rapidly to Earth!
This procedure need not be limited to continuous functions. The sequence of maps appears continuous but is in fact discrete. Animaps can easily be used as well to model discrete series.
What can be used in one direction to shed light on geographic ideas
can be turned around to make possibly difficult mathematical ideas more
appealing to learn. This sort of idea is just a beginning--the
reader
might try numerous other interesting variations on this theme.