TABLE OF CONTENT
Front matter: Winter, 1997 Editorial
Board, Advice to Authors, Mission Statement.
John D. Nystuen. The
Photographic Record. SunSweep: A Visit on the Summer
Solstice.
Sandra L. Arlinghaus, Frederick L. Goodman, Daniel A. Jacobs.
Buffers
and Duality.
Sandra L. Arlinghaus, William C. Arlinghaus. A
Graph Theoretic View of the Join-Count Statistic.
John D. Nystuen, Andrea I. Frank. Differences
in Feature Representation in Digital Map Bases.
Index: 1990-1997. Solstice
archive.
SOLSTICE:

AN ELECTRONIC JOURNAL OF GEOGRAPHY AND MATHEMATICS

http://www.imagenet.org


WINTER, 1997


VOLUME VIII, NUMBER 2


ANN ARBOR, MICHIGAN


Founding Editor-in-Chief:

     Sandra Lach Arlinghaus, University of Michigan;

        Institute of Mathematical Geography (independent)


Editorial Advisory Board:

  Geography.

     Michael F. Goodchild, University of California, Santa Barbara

     Daniel A. Griffith, Syracuse University

     Jonathan D. Mayer, University of Washington (also School of Medicine)

     John D. Nystuen, University of Michigan

  Mathematics.

     William C. Arlinghaus, Lawrence Technological University

     Neal Brand, University of North Texas

     Kenneth H. Rosen, A. T. & T. Bell Laboratories

  Engineering Applications.

     William D. Drake, University of Michigan

  Education.

     Frederick L. Goodman, University of Michigan

  Business.

     Robert F. Austin, Austin Communications Education Services.


Technical Editor:

     Richard Wallace, University of Michigan.


Web Design:

     Sandra L. Arlinghaus

     William E. Arlinghaus.


WebSite:  http://www.imagenet.org

Electronic address:  sarhaus@umich.edu


MISSION STATEMENT

     The purpose of Solstice is to promote interaction between geography

and mathematics. Articles in which elements of one discipline are used to

shed light on the other are particularly sought.  Also welcome are

original contributions that are purely geographical or purely

mathematical.  These may be prefaced (by editor or author) with commentary

suggesting directions that might lead toward the desired interactions.

Individuals wishing to submit articles or other material should contact an

editor, or send e-mail directly to sarhaus@umich.edu.


SOLSTICE ARCHIVES

     Back issues of Solstice are available on the WebSite of the Institute

of Mathematical Geography, http://www.imagenet.org and at various sites

that can be found by searching under "Solstice" on the World Wide Web.

Thanks to Bruce Long (Arizona State University, Department of Mathematics)

for taking an early initiative in archiving Solstice using GOPHER.


PUBLICATION INFORMATION

     The electronic files are issued yearly as copyrighted hardcopy in the

Monograph Series of the Institute of Mathematical Geography.  This

material will appear in Volume 21 in that series, ISBN to be announced.

To order hardcopy, and to obtain current price lists, write to the

Editor-in-Chief of Solstice at 2790 Briarcliff, Ann Arbor, MI 48105, or

call 313-761-1231.

     Suggested form for citation:  cite the hardcopy.  To cite the

electronic copy, note the exact time of transmission from Ann Arbor, and

cite all the transmission matter as facts of publication.  Any copy that

does not superimpose precisely upon the original as transmitted from Ann

Arbor should be presumed to be an altered, bogus copy of Solstice.  The

oriental rug, with errors, serves as the model for creating this weaving

of words and graphics.


Related Solstice link:


http://www-personal.umich.edu/~sarhaus/image/solstice/sols191.html

article about SunSweep
JOHN D. NYSTUEN
Mail to author
nystuen@umich.edu
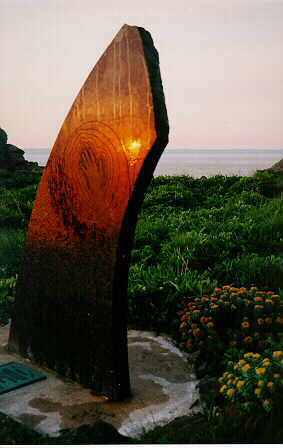
A recent visit to Campobello Island in Canada, off the coast of the
state of Maine, offered an opportunity to view the eastern element of
sculptor
David Barr's Sunsweep: an arch (both physical and virtual) that
celebrated
the U.S./Canadian
border with physical endpieces on Campobello and Point Roberts WA and
a physical keystone in Lake of the Woods, MN. The actual stone
elements
are linked virtually in the mind along the border as the sun
sweeps
from east to west--all are
aligned to astronomical events and access to all requires a border
crossing. Colleagues and I had worked with Barr in a number of
ways
and that work was written about in an earlier number of Solstice (1991,
Number 1; a
direct link to that article). Indeed, as we noted,
Information about SunSweep may be obtained at the Information Office
at the Park Entrance.
 SunSweep,
Campobello International Park
SunSweep,
Campobello International Park
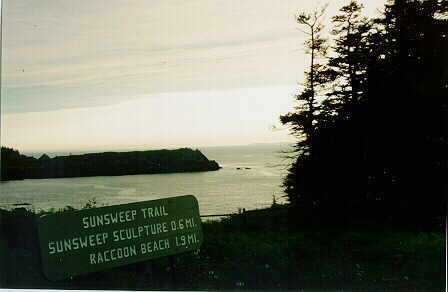 Guidepost
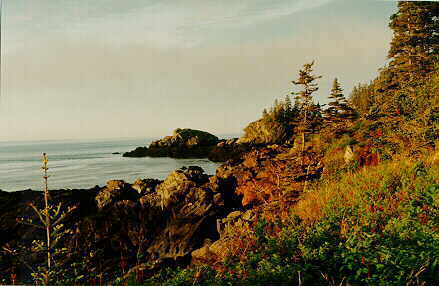
 A view from
a distance of Ragged Point and SunSweep
A view from
a distance of Ragged Point and SunSweep
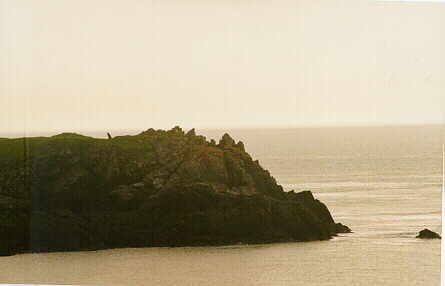 A longer
view of Ragged Point and SunSweep
A longer
view of Ragged Point and SunSweep
 On the
SunSweep Trail; 1 km path from parking area to sculpture.
On the
SunSweep Trail; 1 km path from parking area to sculpture.
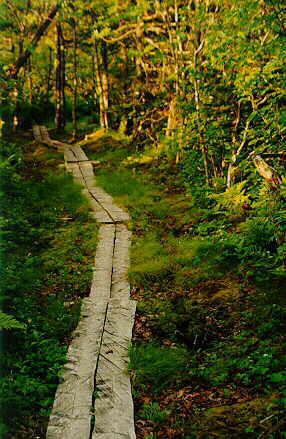 Farther
along the trail
Farther
along the trail
 View from
Ragged Point
View from
Ragged Point
 View
eastward from Campobello Island
View
eastward from Campobello Island
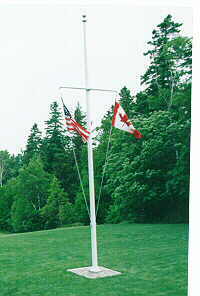 Flags of
the Campobello International Park
Flags of
the Campobello International Park
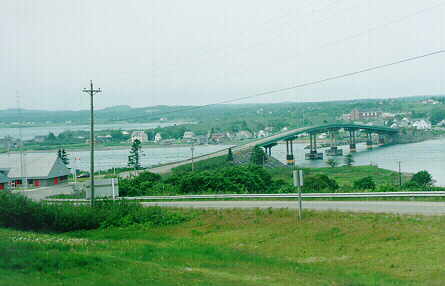 Bridge from
U.S. Mainland to Campobello Island (Canadian).
Bridge from
U.S. Mainland to Campobello Island (Canadian).
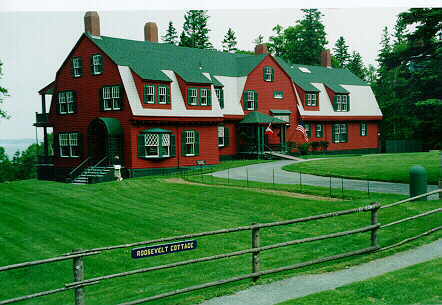 FDR's
cottage on the island
FDR's
cottage on the island
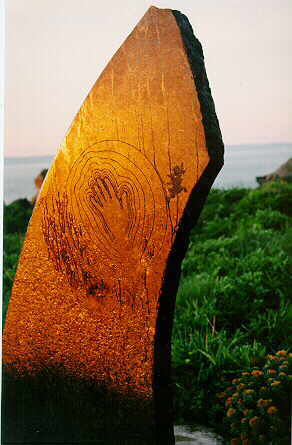 Arch is
made of etched Canadian granite
Arch is
made of etched Canadian granite
 "Sunrise
at Campobello"
"Sunrise
at Campobello"
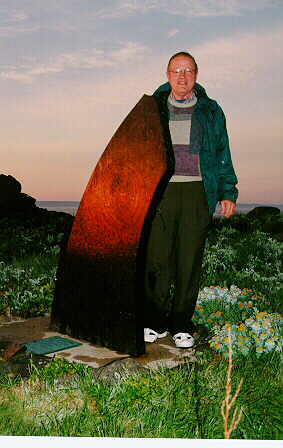 John D.
Nystuen at the arch.
John D.
Nystuen at the arch.
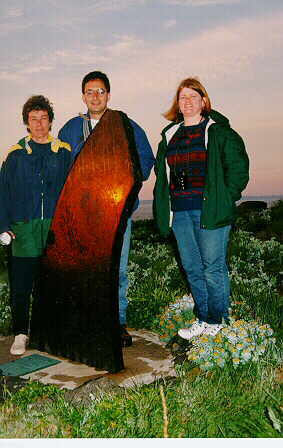 Rhonda
Ryznar, Rich Rovner, Leslie Nystuen: members of the solstice
party.
Rhonda
Ryznar, Rich Rovner, Leslie Nystuen: members of the solstice
party.
Related Solstice

links:


http://www-personal.umich.edu/~sarhaus/image/solstice/sols196.html

Jacobs, US 12 article


http://www-personal.umich.edu/~sarhaus/image/solstice/sols295.html

Arlinghaus, Spatial Planning article
Sandra L. Arlinghaus, Frederick L. Goodman, Daniel Jacobs
e-mail to authors:
Arlinghaus
Goodman
Jacobs
Duality
The basic idea, however, of geographic lines having a dual role may well be as old as the human race; what child has not noticed that the bridge used to cross the creek can also be used as a dock from which to launch paper boats downstream? Enduring ideas remain fertile because their simple, elegant character permit many interpretations.
Duality is a concept that is useful when looking at the whole of an entity. A purely dual situation is one that exhibits perfect symmetry. The non-Euclidean world of projective geometry exhibits complete duality of statement: "two points determine a line" and "two lines determine a point" are equally valid projective statements (Coxeter, 1955). In the Euclidean world they are not, of course, equally valid statements. Parallel Euclidean lines do not meet in a point. This sort of pure symmetry is possible only in abstract worlds: "barriers are carriers" and "carriers are barriers" can become equivalent only in abstract geographic space.
Buffers
One way to mitigate the barrier/carrier dichotomy associated with real-world geographic lines is to expand the dimension of the geographic line. Mark Jefferson’s provocative early twentieth century maps illustrate this idea. Jefferson’s introduction of a 10 mile buffer behind each railroad line in Europe (Figure 1) causes one to grasp simultaneously where there are, and where there are not, both rails and civilization, (Jefferson, 1928). Spreading the line offered extra insight into process: the role of the railroad in settlement patterns.
Jefferson’s map employs a jump in dimension to offer extra insight:
from the one dimensional cartographic line representing the railroad to
the two dimensional rail buffer swath. Jefferson’s jump is in Euclidean
dimension; indeed, the underlying mathematics on which the additional
insight
is based is discrete in its logical form. There are gaps between
Euclidean
dimensions.
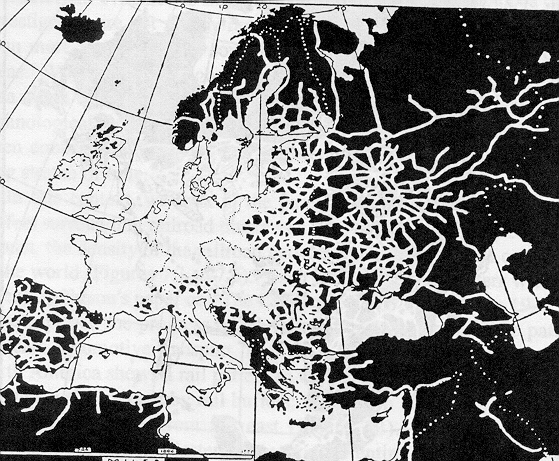
Figure 1. Mark Jefferson’s map of Europe, The Civilizing Rails (1928) (reference below), provokes a strong visual image of the role of the railroad in the settlement of this region. Buffers tracing railroad routes are 10 miles wide. Cited here along general guidelines communicated by Jefferson family.
A different strategy to analyze the duality of barrier and carrier was employed by Arlinghaus and Nystuen (1990) using fractional dimensions (fractals) based on continuous mathematics (Mandelbrot, 1983). Often, condominium complexes are built to take advantage of some interesting natural view; nonetheless, residents also generally wish easy access to and from their homes. In this case, an ideal planning situation might seek to maximize public interest (in view and access) and minimize environmental damage. The fractal approach offers cuts of the land with a view of the water out the front with a road in the back. It minimizes coastal damage by maximizing space-filling characteristics of the cuts. A local Michigan condominium developer pursued actual development of this project and found that the costs of dredging were prohibitive. Self-similar space-filling curves were used to generate a shape that spoke to one abstract mini-max principle; at the applied level however other issues precluded actual project realization.
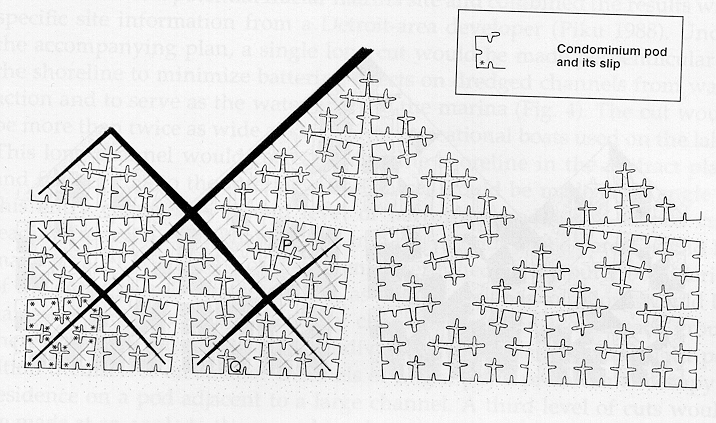
Figure 2. Space-filling marina based on fractional dimensions for dual land/water access; base map used to generate map that appeared in Arlinghaus and Nystuen, Geographical Review article cited in references.
In the map of Figure 2, the boundary is allowed to fill space (gain higher fractional dimension) until a condition of optimal exchange across, and flow along, the housing/marina complex boundaries is achieved. Dimensional alterations can create various degrees of resolution of abstract dual situations, and they can do so from a fundamental viewpoint that is either discrete or continuous. Such resolutions are of course particularly useful when they mesh with real-world economic and other considerations. Failure to find such a fit does not however mean that such an approach should be abandoned. The planning effort driven only by the bottom line is just as ineffective as the planning effort driven only by abstract concepts.
The U.S. Route 12 Buffer and Virtual Classroom
The man-made carrier of the railway line, vital in opening up new territories, suggests capturing disparate human characteristics in various buffers and using these buffers to tap perhaps unforeseen resources. The railroad can represent far more than a cartographic line on a map. Goodman and Jacobs, in a current education project, are creating a community of education travelers, in both actual and virtual space, within the set of schools, museums, universities, and other educational institutions along the U.S. 12 buffer (from Detroit to Aberdeen, Washington; Figure 3).
The Route 12 Project was created as a means through which diverse elements of local and national communities can come together. It is an educational network, both electronic and physical, that is unfolding in the counties along Route 12. Teachers and students, alike, use the network to share ideas, lessons, research, local historical information, and a host of other educational resources. The child from the inner city of Detroit becomes "adjacent" to colleagues on farms in rural Idaho. Indeed, one exchange has seen students from Detroit sharing first hand, their view of information about the development of the U.S. auto industry with students from Bowman, North Dakota. The North Dakotans in return offer to the Detroiters a view of critical dependence of a town, not on the automobile, but rather on the railroad. Extension of contact in space, coupled with expansion of a line to a buffer, mitigate self-centeredness; apparently of particular importance in geographic education in a country of physical extent as vast as is ours. As with Nystuen’s oysters in Chesapeake Bay, the child "barometers," physically fixed in positional locale along the US-12 corridor, become movable in virtual space. This movement frees the imagination to participate in diverse educational activities not previously easily available and such freedom serves also to defeat geographic isolationism so common when the child’s world is only a tiny part of the globe. The virtual classroom, developed along the computer networks in this geographic corridor, offers an exciting basis for developing cross-cultural understanding.
The initial development of this classroom rests, however, on traditional field methods in which both Goodman and Jacobs go to the participants and expend substantial effort assessing what sorts of resources might be available at different locations and convincing individuals of the merits of participation based on the resource assessment. To date, Jacobs has made three trips across the entire corridor. He has also made partial trips, hauling a classroom of 6th grade students from Detroit Open School across U.S.12 to the western edge of Michigan. Indeed, as James Edwards, principal of Walker Elementary school (in Canton, Michigan) put his vision of the Route 12 Project: it is "a program that could not only supplement a child’s regular education, but also give him or her a stronger sense of community and belonging. This feeling of community is invaluable for the students’ holistic educational process. Broad local support is imperative if we expect our children to assume responsibility for and leadership in their community." It is to this broader sense of community that the Route 12 project speaks.
Not only does the Route 12 Project fit within the pragmatic view of the school principal’s broad assessment of student education, but also it fits within the broader scholarly realm of previous geographical and mathematical analyses. The Euclidean extension of the U.S. 12 route, in the style of Jefferson, to a zone of buffers based on county boundaries permitted the capture of a set of schools and the creation of a virtual U.S. 12 classroom. Visual implementation of positional data was executed in the Euclidean world of GIS; the technology matched the dimension and faithfully portrayed data associated with this Euclidean buffer.
When Jacobs made three trips covering the buffer, with children from various schools within the buffer, his effort reflected that of Arlinghaus and Nystuen in filling in between the integral dimensions. The difference is that while his travels fill a gap in the real world, the electronic world of the GIS is not routinely based on a mathematics that fits fractional dimensional analysis. Thus, unlike the work of Arlinghaus and Nystuen in which the mathematics did fit the environment, it is left to the future to fill in this piece in the abstract setting of the Route 12 Project. The correspondence between scholaraly ideas is, at this stage, asymmetric.
Asymmetry
Often when one thinks of interweaving the abstract and the applied, the abstract is discarded if it does not meet the test of application. There is asymmetry in considering the merits these two different approaches have to offer. Indeed, the practical approach of an overlay, exhibited by county buffer superimposed on Route 12, could offer to municipal authorities across a broad spectrum of geographic scales, from the city, to the county, to the state (for example), of convincing evidence on the merits of overlay legislation. From a practical and applied standpoint, one must, at some level, confine laws to geographically defined and confined regions. Often, however, natural features, educational concerns, and other far-flung notions transcend political boundaries. The geographic literature, newspapers, and other sources are filled with example. One quite standard one involves watersheds (Figure 4).
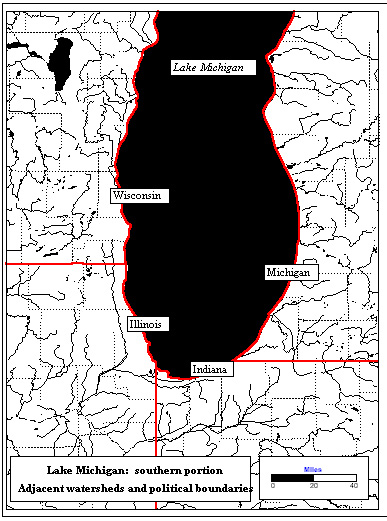
Figure 4. Natural watercourses overlain with political boundaries at the county and state levels. Base map from Atlas GIS, v. 3.0.3 with hydrological layers superimposed from the Digital Chart of the World.
Developers and municipal authorities often care how new development
will affect an adjacent neighbor. But, what does "adjacent" mean? All
too
often, it simply means "shares a man-made boundary." This meaning
illustrates
that it is the man-made boundaries that dominate: the Route 12
classroom
suggests that even when man-made boundaries help to define geographic
extent,
it is possible for concerns other than the political to become
dominant.
Thus, in the watershed example, if "adjacent" instead means "shares a
watercourse
with" then the watershed, rather than the political entity, has become
the fundamental planning unit. A brief glance at almost any map that
shows
both drainage networks and political boundaries illustrates that they
have
little in common (Figure 4). The fit is bad. Here, perhaps, the
abstract
idea of using the drainage basin as a fundamental unit should take the
lead and laws of units more local than a drainage basin made to fit
within
the basin…a case in which the abstract guides the applied.
Applied Geography of the U.S. 12 Project
The Route 12 Project approach also has precedent, in the applied realm, in other parts of the world.
One traditional way to stretch a child’s view or imagination is to do so physically, through travel or through direct contact with others his or her age across a spectrum of geographically distant points and cultures. Hence the presence of field trips, pen-pals, and other time-tested strategies are common in the pre-collegiate curriculum. The presence of electronic networks offers yet other imaginative ways to achieve similar ends; when these are coupled with electronic mapping capability they not only stretch viewpoint, but increase geographic awareness and knowledge, as well.
When GIS is introduced, the spatial connections that are being forged in the virtual classroom of U.S. 12, become evident visually. As did Jefferson’s maps, the map of the U.S. 12 county buffer (Figure 3) presents a clear image of geographic position in relation to a network. Jacobs introduced census data into the U.S. 12 Buffer to illustrate locations of linguistic groupings along the U.S. 12 network. Students thus use maps to find not only their position along the U.S. 12 classroom, but also their position based on heritage in the broader linguistic family tree of mankind (Figure 5 exhibits one map from a set of about 100 different ones that Jacobs has generated).
The maps are employed not merely to show the power of electronic mapping, but also to form images in fertile young minds that would certainly not easily have been available in pre-GIS mapping days. Maps that are tailored to the project at hand, that are inexpensive, and that can readily be given to each child, offer great promise in overcoming educational inadequacies so evident in the pre-collegiate geographical curriculum.
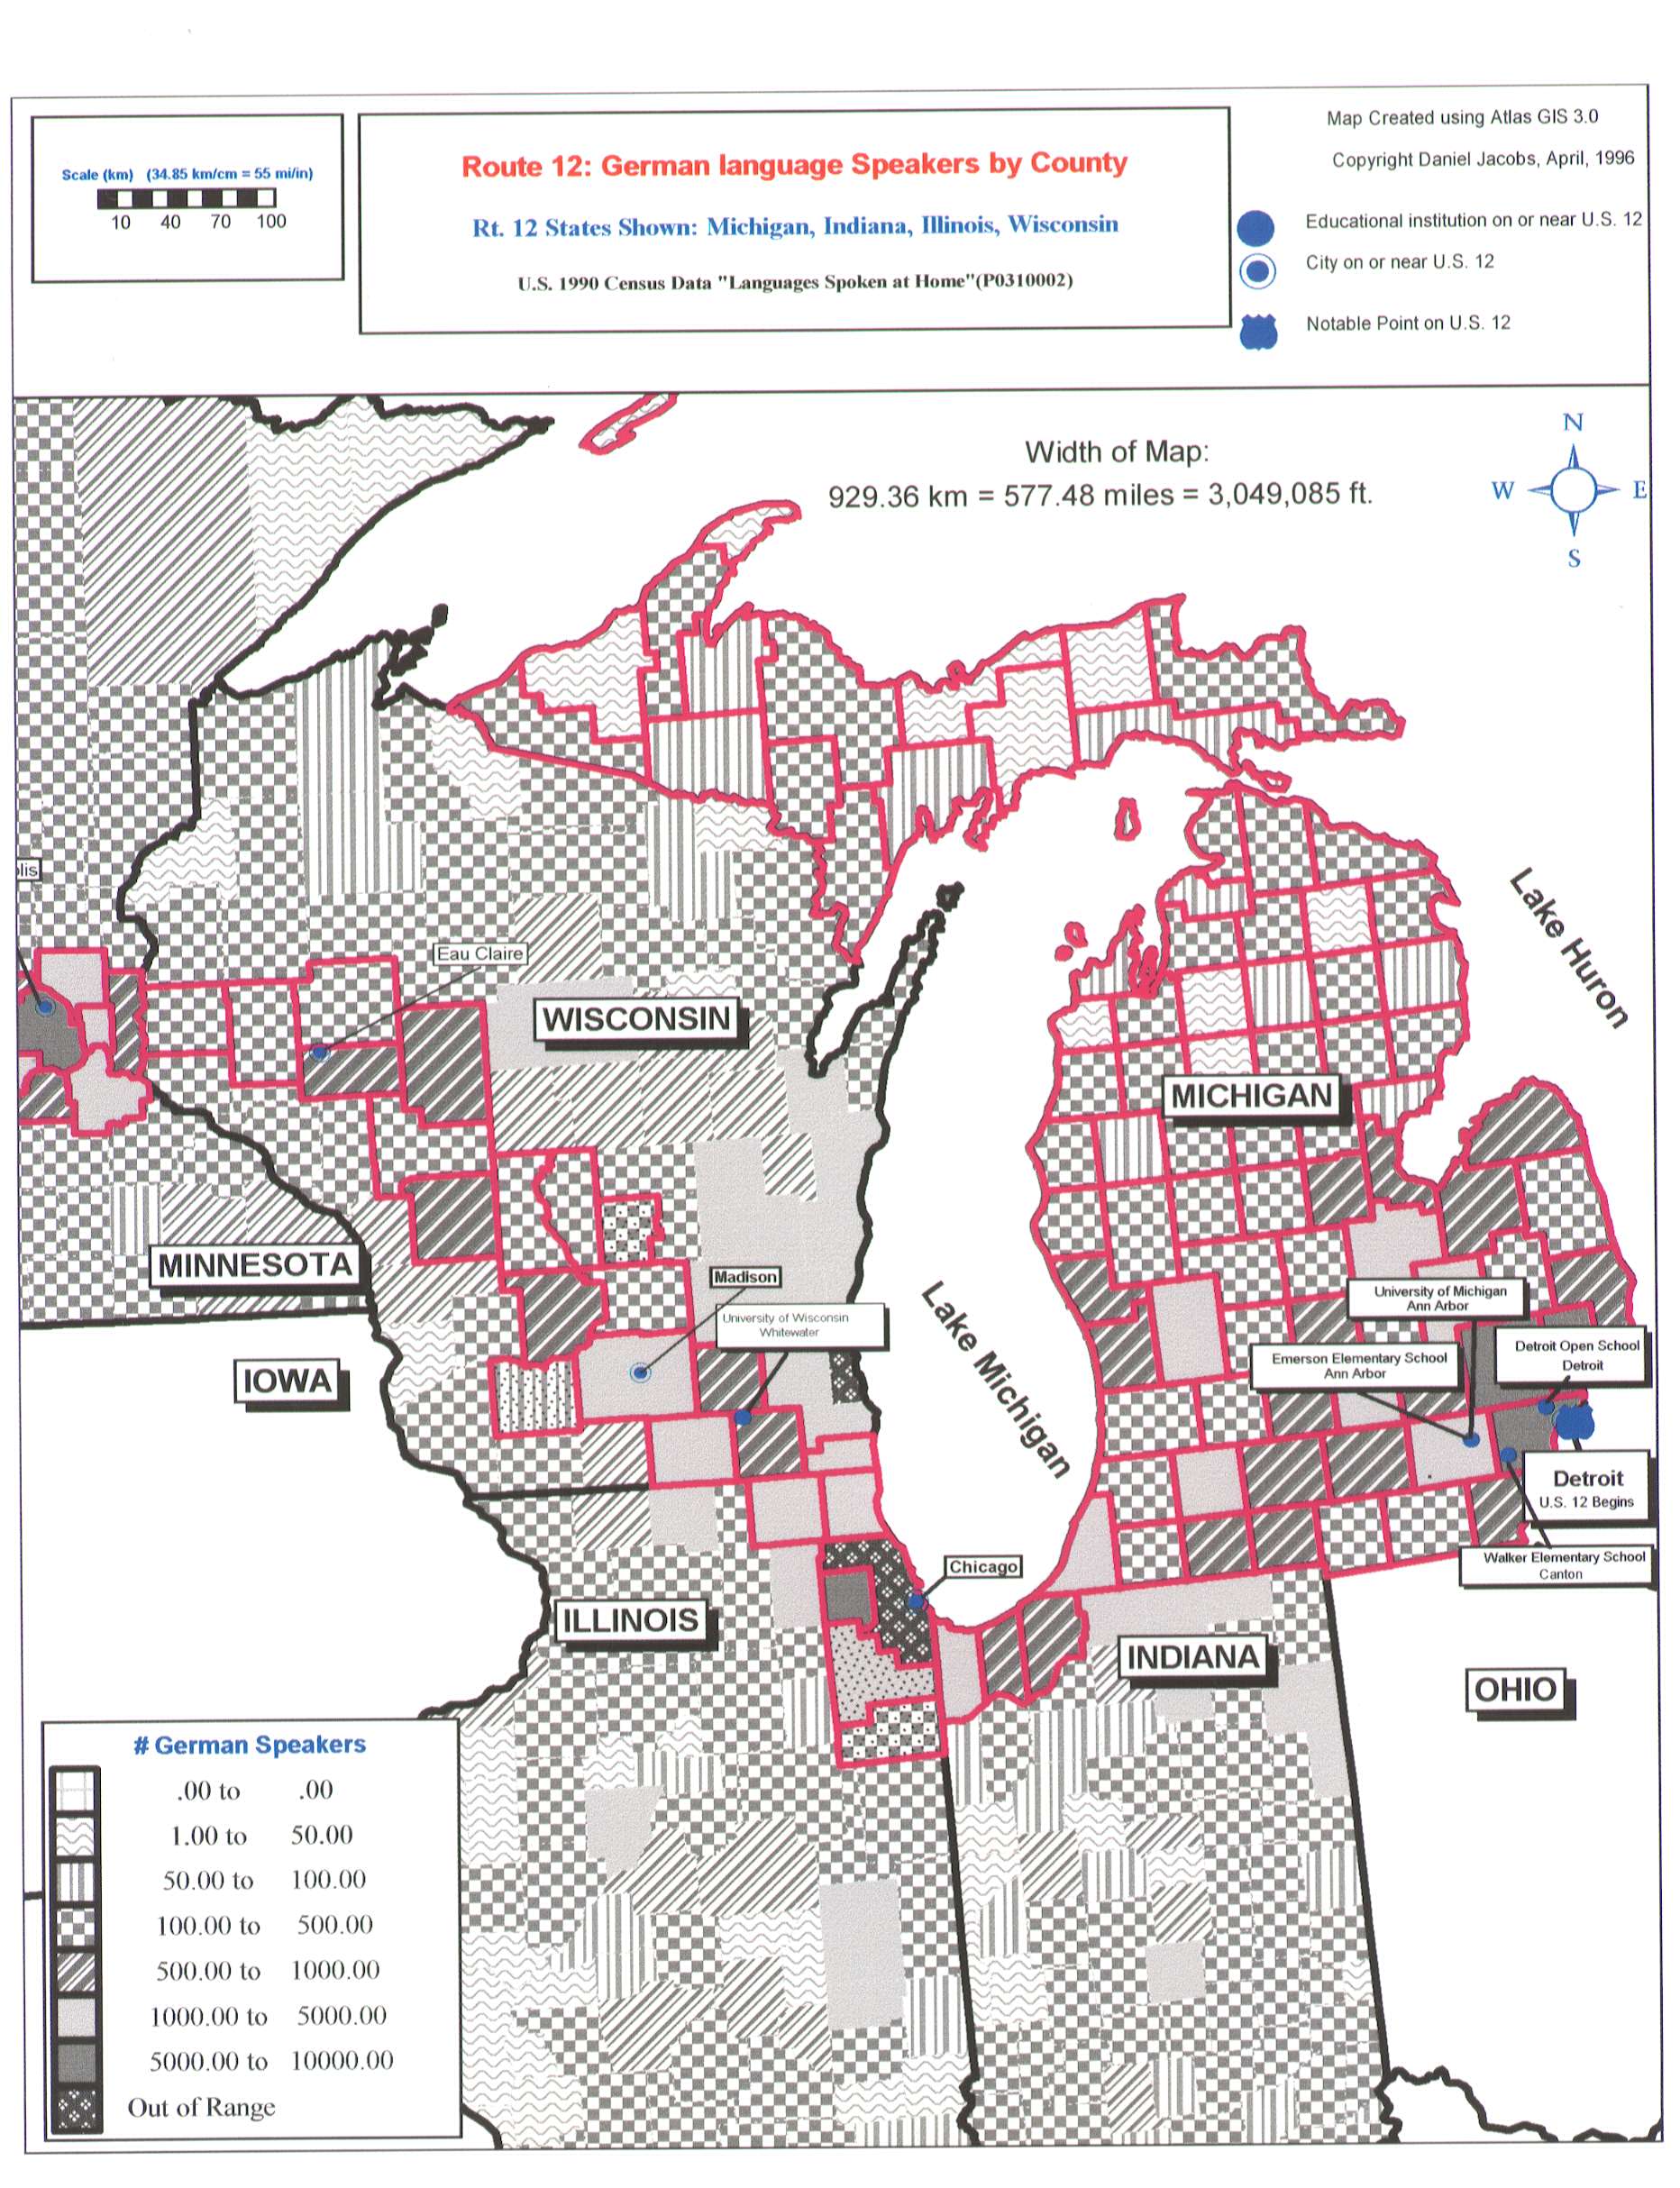
Figure 5. Jacobs’ map of German speakers in the eastern portion of Route 12 county (and state) buffers. The U.S. Census measures 24 distinct language categories under the heading of "Languages Spoken at Home." Basemap: Atlas GIS, v.3.0.3; data: U.S. Bureau of Census.
As are roads, rails, and rivers, natural languages are also both barriers and transmitters. Jacobs and Goodman capitalize on this observation to communicate disparate concepts within a single virtual classroom. In so doing they weave together the regional "dialects" of the urban/rural as well as of urban/suburban, rich/poor, and various permutations of these and other socio/demographic indicators, into an educational fabric far richer than the sum of its dichotomous parts.
REFERENCES
Abler, J. S.; Adams, J.; and Gould, P. Spatial Organization: The Geographer's View of the World. Prentice-Hall: Englewood Cliffs, 1971.
Arlinghaus, S. Solstice article linked at the top of this page.
Arlinghaus, S. L. and Nystuen, J. D. Geometry of Boundary Exchanges. Geographical Review. American Geographical Society, 21-31. 1990.
Coxeter, H. S. M. The Real Projective Plane. Cambridge (Engl.) University Press. 1955.
Goodman, Frederick L. Continuing communications.
Jacobs, Daniel. The Route 12 Project Newsletter. Privately distributed.
Jacobs, Daniel. Solstice article, linked at the top of this page.
Jefferson, Mark. The Civilizing Rails. Economic Geography, 1928, 4, 217-231.
Mandelbrot, Benoit. The Fractal Geometry of Nature. W. H. Freeman: San Francisco, 1983.
Nystuen, J. D. Boundary shapes and boundary problems. Papers of
Peace
Research Society International 7:107-128. 1967.
Link to related Solstice
article:
http://www-personal.umich.edu/~sarhaus/image/solstice/sols193.html,
Sum-graph article, Arlinghaus, Arlinghaus, and Harary.
A GRAPH THEORETIC VIEW OF THE JOIN-COUNT STATISTIC
SANDRA L. ARLINGHAUS AND WILLIAM C. ARLINGHAUS
Spatial autocorrelation measures, to some extent, the influence of neighboring regions on each other. Given a thematic map, with regions colored by some variable, two regions are defined to be adjacent (neighbors) if they have a common boundary that includes a line segment (touching at a point, only, does not constitute adjacency). With positive spatial autocorrelation, similar values of the variable are clustered in space. With negative spatial autocorrelation, dissimilar values of the variable are clustered in space. No spatial autocorrelation indicates a random pattern of clustering in space.
How to set bounds for "positive", "negative", and "no" spatial autocorrelation is a problem with an infinite number of solutions. One way, the join-count statistic, is through analogy with simple biological patterns of "pure" and "hybrid" inheritance patterns. Often the biological model is explained using eye-color. Instead, suppose that one mapped variable is "urban". Suppose there are two possible values for this variable…urban, and non-urban (called rural). Represent one state as U and the other as R. Then there are four possible adjacency patterns for any pair of adjacent parcels: UU, UR, RU, and RR. At random, each of these occurs 25% of the time. Thus, pairs of parcels of dissimilar character would be expected 50% of the time. When UR+RU<50%, it follows that values for UU and RR are higher than expected; a condition of positive spatial autocorrelation. When the values are about as expected, the pattern is random. When UR+RU>50%, spatial autocorrelation is negative; dissimilar pairs of parcels dominate (Vasiliev, in CRC Practical Handbook of Spatial Statistics).
In the map of a hypothetical region below, there are 5 states. The ones of largely urban character are colored purple; rural ones are colored green. The name of each state (A, B, C, D, or E) is inserted as a label. We offer a method of looking a clustering that uses graph theoretic ideas.
Any spatial object composed of areas and linkages between areas can
be represented as a graph: nodes and edges linking nodes.
When
the areas are colored, the corresponding nodes can also be colored to
represent
the map coloring. The map above can therefore be represented as a
graph with colored nodes as below. Two nodes have an edge linking
them if and only if the nodes represent adjacent areas on the
map.
Thus, A is adjacent to B, C, and D in the map, but not to E; in the
graph
there are edges linking A to each of B, C, and D, but not to E.
Enumeration of linkage patterns of colored nodes is tracked quite
simply
using an adjacency matrix. The nodes are lined up in any order
along
the top and the left-hand side (for example) of a matrix. A value
of 0 in the AC position indicates that there is no link between nodes A
and C; that these nodes do not represent adjacent areas on the
map.
A value of 1 in the AC position would indicate that there is a link
between
A and C; that these nodes do represent adjacent areas on the map.
Thus, one might choose to merely arrange the labels for the areas in
alphabetical
order. The colors behind the node labels represent the node
colors.
The colors behind the numerals indicate what sort of adjacency pair
that
numeral represents: a light purple background indicates a
urban/urban
pairing; a light green background a rural/rural pairing; and, a white
background
a rural/urban or a urban/rural pairing. In that case, the
following
adjacency matrix emerges:
| A | B | C | D | E | |
| A | 0 | 1 | 1 | 1 | 0 |
| B | 1 | 0 | 1 | 0 | 0 |
| C | 1 | 1 | 0 | 1 | 1 |
| D | 1 | 0 | 1 | 0 | 1 |
| E | 0 | 0 | 1 | 1 | 0 |
However, we do have the freedom to choose other orderings for the
labels
without altering any of the results. This particular ordering,
based
on alphabetical order of place names, does not lend any additional
insight.
It is useful to choose an ordering that does so. If instead, one
orders the place names into two groupings, rural and urban, then the
resulting
matrix is partitioned into sets of 0s and 1s in which the size of the
"pure"
and "hybrid" adjacency patterns can be read directly from the
matrix.
Clustering rows and columns in the matrix reflects corresponding
clustering
in the map, as below. Both matrices are symmetric about the main
diagonal and both matrices have 0s all along the main diagonal;
in
addition, the rural and urban blocks of submatrices are clustered
together
along the main diagonal in the matrix below. In the matrix above,
they are not. Spatial autocorrelation with adjacency matrices is
useful in displaying spatial autocorrelation in the associated map from
which the adjacency matrix was derived. Order of labels can be
critical.
| A | C | B | D | E | |
| A | 0 | 1 | 1 | 1 | 0 |
| C | 1 | 0 | 1 | 1 | 1 |
| B | 1 | 1 | 0 | 0 | 0 |
| D | 1 | 1 | 0 | 0 | 1 |
| E | 0 | 1 | 0 | 1 | 0 |
From the matrix below, it is easy to read off that of the 14 cells in which there is an edge (of the 14 pairs of adjacent regions)
UU=2
UR=5
RU=5
RR=2
so that RU+UR>14/2
and autocorrelation is negative; dissimilar regions are clustered.
Directions for further research are suggested by the cleanly-colored adjacency matrix sorted into blocks that mesh with the basic problem structure:
Arlinghaus, S.; Griffith D.; Arlinghaus, W., Drake, W., Nystuen, J. CRC Practical Handbook of Spatial Statistics. 1996. CRC Press.
Abstract
Map databases are integral to many ITS (Intelligent Transportation Systems) applications in navigation, traffic forecasting, and route planning. With the increasing deployment of ITS technology demands for accurate and complete digital map databas es of the nation's road network are surging. The development and maintenance of high quality digital map databases is expensive and time-consuming. Database sharing will be a sensible approach whenever possible in order to reduce cost. In the US map da tabases are being produced by a variety of public agencies and private vendors. Quality and levels of accuracy vary depending on data sources and production procedures. Verifying the quality and accuracy of map databases for purposes of navigation is a p ragmatic and important concern. The Society of Automotive Engineers (SAE) has developed a Truth-in-Labeling Standard (SAE document J1663), the goal of which is to provide a consistent method for describing and comparing map databases. While the standard requires that database vendors provide a standardized label that lists basic database characteristics such as lineage, coverage, accuracy, content and scope of a database, there are currently no guidelines for feature representation (such as the layout of road intersections) in digital databases. Comparison of two different map databases reveals significant representational differences due to differences in precision of source material, data model and intended uses.
Problem
Current standards for data exchange are insufficient for unambiguous and successful transfer of information between digital map databases, in part because of semantic differences in feature representation. Real world entities are complex. Which fac es of this complexity are captured in the feature representation depend upon broader contexts and circumstances than can be reported in the metadata statements about the database. The examples presented here illustrate the dimensions of this problem.
Keypoints
Various reasons for the different representation of features in digital map databases exist. Four main reasons/sources of representational differences are distinguished. They are illustrated and discussed below.
1. Differences in Feature representation due to different interests. Agencies and companies focus on different types of geographic features. Municipal governments often take an area-oriented perspective, representing parcels and streets as polygons. Vendors of digital navigation maps use a network view with street addresses, street names and driver instructions.
Figure 1a
Figure 1b
2. Differences in feature representation due to underlying data model. There are many public and private sources for digital map data. Agencies and companies develop their own data models that may be proprietary. "Stone School Rd" crossing the Inter state shows that one database uses a planar model (black arclines), whereas the other employs a non-planar model (blue arclines, no nodes).
Figure 2
3. Differences in feature representation due to individual preferences. Operators who digitize maps may develop individual ways to represent features such as road intersections or dead end streets.

Figure3a

Figure3b

Figure3c
Figure3d
4. Difference in feature representation due to map scale and resolution. The larger the scale and finer the resolution of the original map, the more detail can be expected in features such as intersections.
Figure 4
Discussion
One means to address standardization of feature representation is to provide detailed descriptions of the data set through metadata. While this is attempted in the new Truth-in-Labeling standard, it does not address feature representation. Metada ta requirements are new. The Truth-in-labeling approach for standards applies to new datasets. Metadata for older dataset are hard to reconstruct; time depth and therefore change data simply may not be available. While standards provide a good start - the descriptive requirements may not be of sufficient detail for meaningful data sharing. Subtle data modeling differences create not so subtle differences in feature representations. Transportation data models may be planar or non-planar. An overpass o f one road over another road in a planar model is generally represented by a node with four incident arcs. The node at the intersection has an associated attribute describing turn restrictions in order to convey the correct driver instructions (i.e. for route guidance). In a non-planar model of the same feature - no node exist since the arcs are unconnected in the 3- dimensional space. Thus, linking non-planar and planar databases is problematic.
Conclusion
The consequences of different feature representation are manifold. In terms of data exchange, data sharing and integration different feature representation leads to
- Lack of comparability (pattern matching)
- Lack of compatibility (data base/model anomalies)
Furthermore results from data analyses performed on different databases are likely to display different results. Differences in feature representation become an issue with increasing interest and need to exchange data. Generally there are two approache s to overcome the problem. 1. Descriptive and detailed metadata provision that includes information on feature representation is used to emphasize the different treatment of the features. 2. Standardization or formulation of conventions for feature repre sentation which consider semantic differences.
Acknowledgments
This research was made possible by a grant from Federal Highway Administration (DOT). We would like to further acknowledge the generous provision of digital map databases and orthophotographs by the City of Ann Arbor, MI; ETAK Corp., Southeastern M ichigan Council of Governments (SEMCOG), and NavTech Inc.
References
Nystuen, John D., Andrea I. Frank and Larry Frank, jr. "Assessing Topological Similarity of Spatial Networks." Paper presented at The International conference on Interoperating Geographic Information Systems INTEROP 97. Sponsored by The N ational Center for Geographic Infromation and analysis (NCGIA). December 3 – 4, 1997. Santa Barbara, CA – USA
Contact
For further information contact:
John D. Nystuen
University of Michigan
College of Architecture & Urban Planning
2000 Bonisteel Blvd.
Ann Arbor MI 48109-2069
Phone: 313-763 9832; E-mail: nystuen@umich.edu
Andrea I. Frank
University of Michigan
College of Architecture & Urban Planning
2000 Bonisteel Blvd.
Ann Arbor MI 48109-2069
E-mail: jambo@umich.edu
