SOLSTICE: AN ELECTRONIC JOURNAL
OF GEOGRAPHY AND MATHEMATICS
http://www.imagenet.org
SUMMER, 1999
VOLUME X, NUMBER 1
ANN ARBOR, MICHIGAN
 Founding Editor-in-Chief:
Sandra Lach Arlinghaus, University of
Michigan;
Institute of Mathematical
Geography (independent)
Editorial Advisory Board:
Geography.
Michael F. Goodchild, University of
California, Santa Barbara
Daniel A. Griffith, Syracuse University
Jonathan D. Mayer, University of Washington
(also School of Medicine)
John D. Nystuen, University of Michigan
Mathematics.
William C. Arlinghaus, Lawrence Technological
University
Neal Brand, University of North Texas
Kenneth H. Rosen, A. T. & T. Bell
Laboratories
Engineering Applications.
William D. Drake, University of Michigan
Education.
Frederick L. Goodman, University of Michigan
Business.
Robert F. Austin, Austin Communications
Education Services.
Book Review Editors:
Richard Wallace, University of Michigan.
Kameshwari Pothukuchi, Wayne State University
Web Design:
Sandra L. Arlinghaus
(with early input from William E. Arlinghaus).
WebSite: http://www.imagenet.org
Electronic address: sarhaus@umich.edu
MISSION STATEMENT
The purpose of Solstice is to promote
interaction between geography
and mathematics. Articles in which elements of one discipline are used
to
shed light on the other are particularly sought. Also welcome are
original contributions that are purely geographical or purely
mathematical. These may be prefaced (by editor or author) with
commentary
suggesting directions that might lead toward the desired interactions.
Individuals wishing to submit articles or other material should contact
an
editor, or send e-mail directly to sarhaus@umich.edu.
SOLSTICE ARCHIVES
Back issues of Solstice are available on the
WebSite of the Institute
of Mathematical Geography, http://www.imagenet.org and at various sites
that can be found by searching under "Solstice" on the World Wide Web.
Thanks to Bruce Long (Arizona State University, Department of
Mathematics)
for taking an early initiative in archiving Solstice using GOPHER.
PUBLICATION INFORMATION
The electronic files are issued yearly as
copyrighted hardcopy in the
Monograph Series of the Institute of Mathematical Geography. This
material will appear in a Volume in that series, ISBN to be announced.
To order hardcopy, and to obtain current price lists, write to the
Editor-in-Chief of Solstice at 1964 Boulder Drive, Ann Arbor, MI 48104,
or
call 734-975-0246.
Suggested form for citation: cite the
hardcopy. To cite the
electronic copy, note the exact time of transmission from Ann Arbor, and
cite all the transmission matter as facts of publication. Any
copy that
does not superimpose precisely upon the original as transmitted from Ann
Arbor should be presumed to be an altered, bogus copy of
Solstice. The
oriental rug, with errors, serves as the model for creating this weaving
of words and graphics.
Dedication
It is with the greatest of pleasure that this issue of Solstice
is dedicated,
on the occasion of his retirement from The University of
Michigan,
to the career of
John D.
Nystuen,
pioneer in spatial analysis and in modern mathematical
geography.
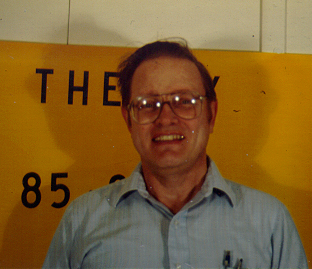 John Nystuen outside IMaGe in 1991.
Metropolitan Mining:
Institutional and Scale Effects on the Salt Mines of
Detroit
John D. Nystuen
The University of Michigan
Revised June 1999; based on earlier work as noted at the end.
Abstract
Mining, as with most industrial activities, is
constrained by logistics,
which involves technological matters of transportation, material
conversion
and energy costs. Convention and law also influence the activity. These
are institutional matters involving mineral rights and access to
resources.
Both logistical and institutional configurations exist in a space/time
context and in metropolitan areas, where geographic space is a complex
mosaic of private and public property, the limits to an industrial
activity
are nicely illustrated in the example of the salt mines of
Detroit.
Introduction
Metropolitan mining refers to industries that extract
minerals or other
materials from locations within highly urbanized regions. The example
of
a metropolitan mine in Detroit reveals some interesting interplay
between
technological and institutional constraints. Industrial activities
operate
in a space/time envelope partially confined by logistics, the physical
task of moving people, things and energy through space and time.
Physical
movements depend on the speed and cost of transportation and
communication--technological
matters employed to overcome the cost of space. Social/economic
behavior
is also constrained by conventions; bound by abstract, imaginary
barriers
that establish entitlement and prescribe behavior--institutional
matters
that have temporal components associated with expectation and risk.
Social
behavior often has geographical manifestations. We know how to behave
on
account of where we are: on sacred ground, on private property, or in a
public forum. Private property, although a very abstract and
multi-dimensional
concept, often includes strong geographical connotation. In this paper
we make reference to one kind of private property, mineral rights used
to gain access to the salt deposits under Detroit.
Every geographical process whether social or physical
also has an intrinsic
or operational scale associating relative size of the elements
contained
in the process. Two components are involved: (a) the diameter of the
system
which may be defined as the longest extent or distance between
interacting
parts and (b) the unit size or smallest extent of an elementary
element.
An elementary element is a part which is treated as a single unit in
the
system and which cannot be subdivided. This requires some elaboration.
Everything and every action take some minimum time and space. We
allocate
time and space among activities according to their needs. We jostle
about
and shoulder one another aside to arrange our affairs spatially and
temporally---that
is geographically. If by chance or otherwise some elements cannot
maintain
their minimum unit size, they cease to exist, in
Hägerstrand's words;
everything has a minimum extent and duration, a kind of kernel or
minimum
unit of existence (Hagerstrand, 1970). This is true of abstract,
institutional
content of our environment as well as in the logistical matters we
face.
The interplay between space and time and scale are nicely illustrated
in
the Detroit Salt Mines of the International Salt Company.
The Geography of Salt Mining
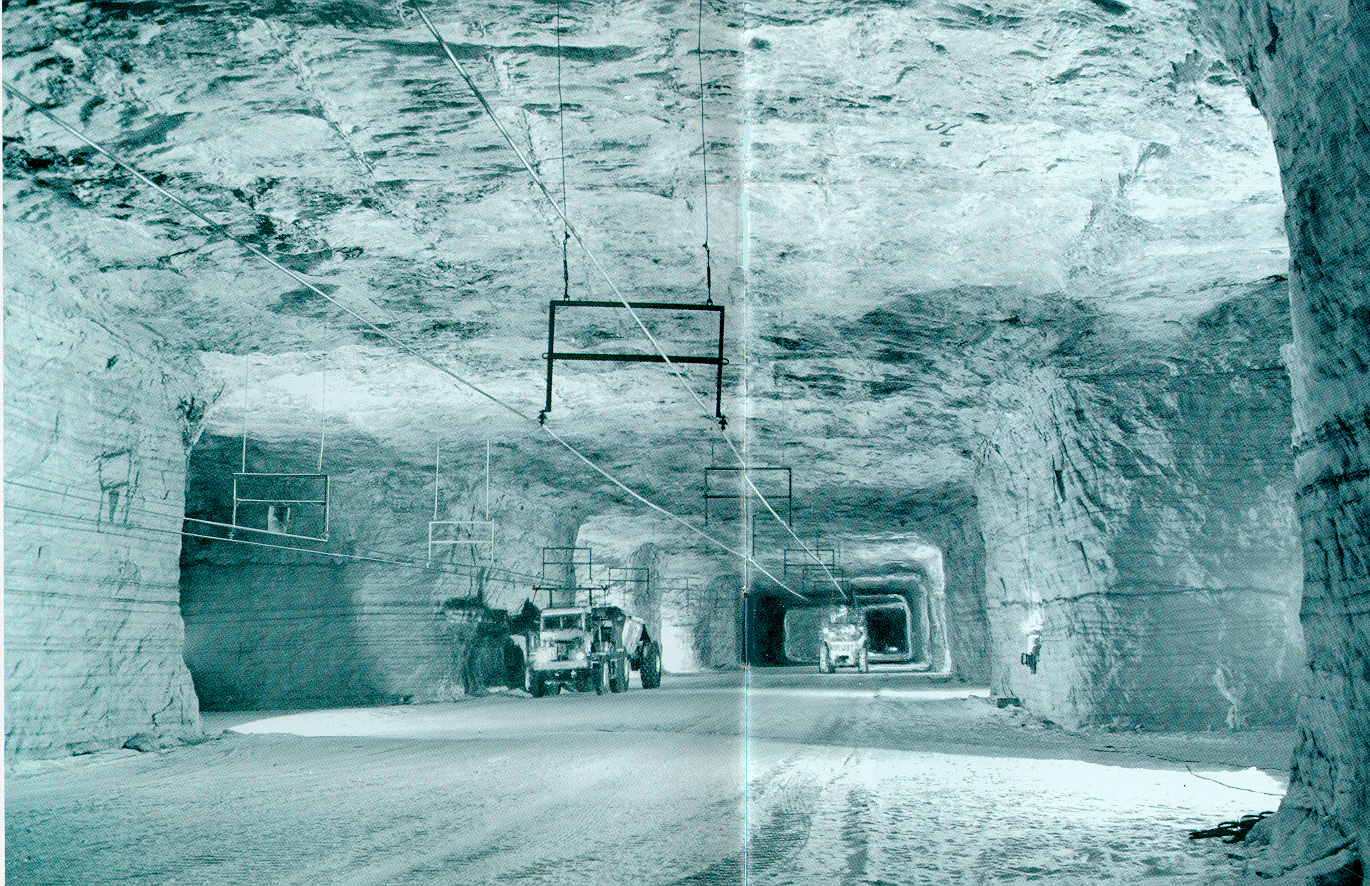
The Detroit salt mine was started 1906 and finally
closed operations
in 1985 after millions of tons of salt had been removed. The work
created
extensive man-made caverns under the city that remain today. The
Detroit
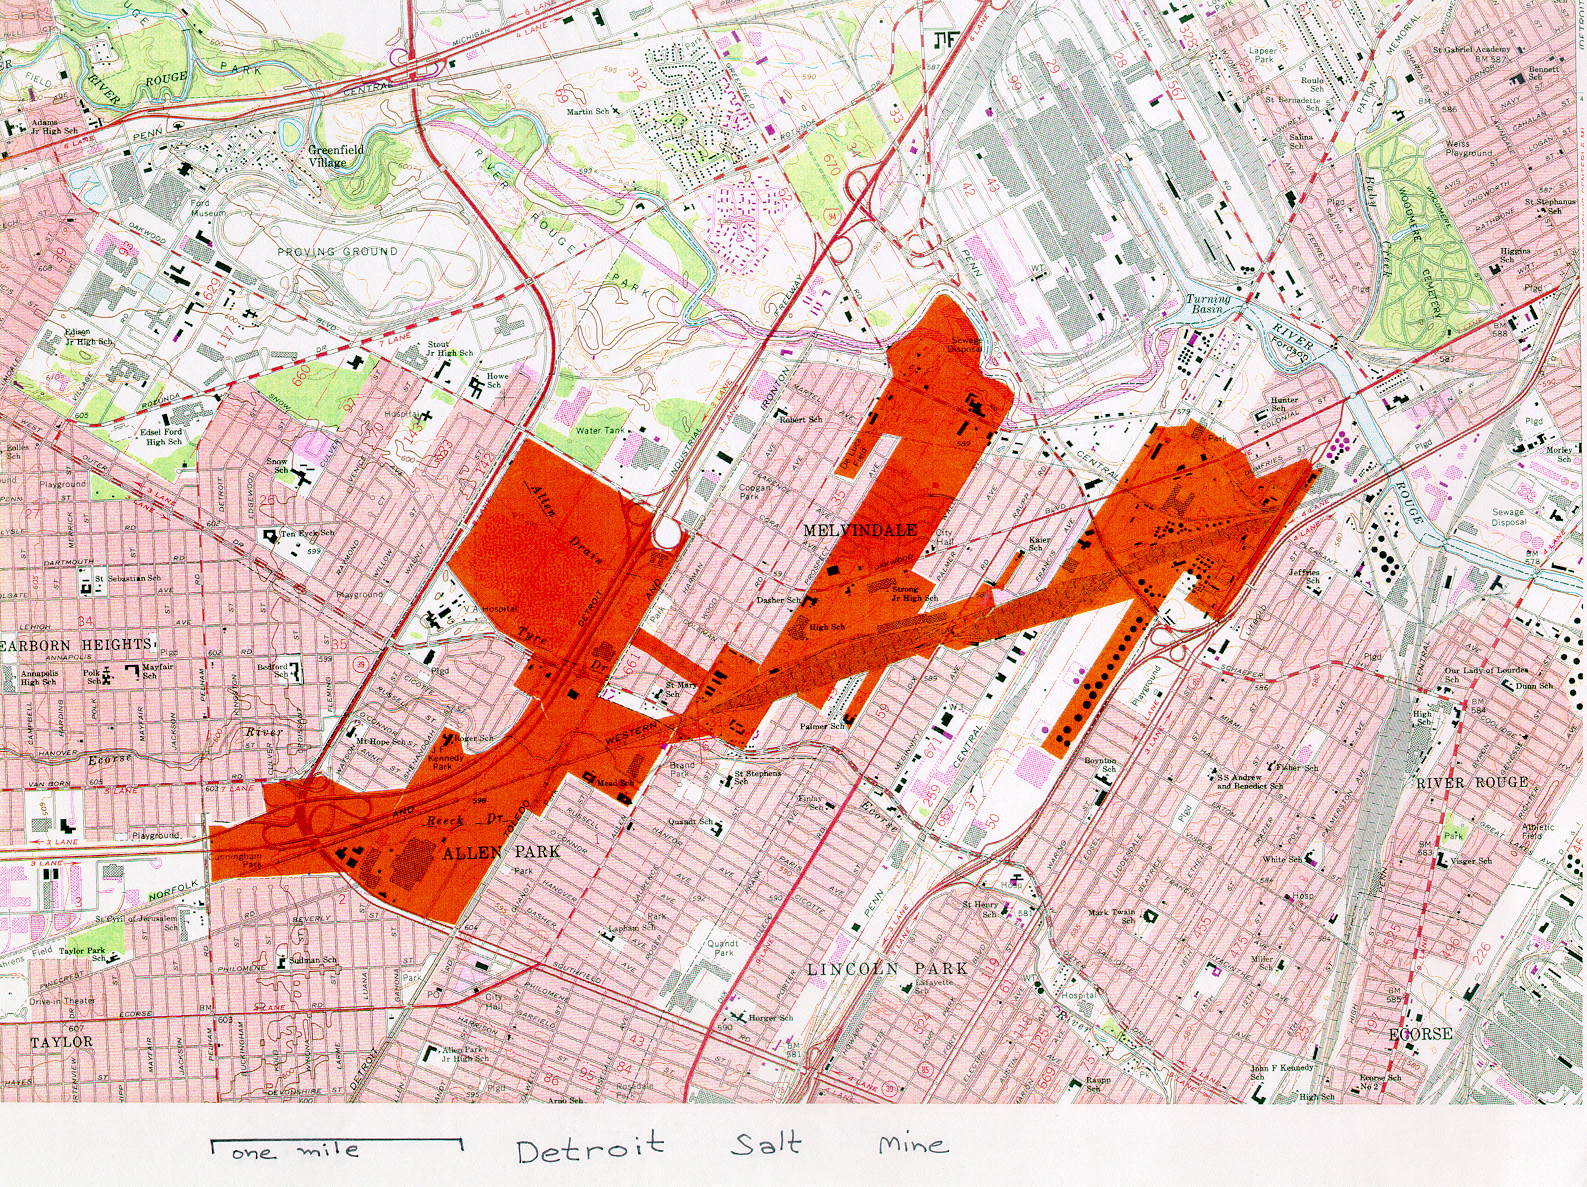
mine has a rather complex shape that is intriguing to geographers and
that
calls for some explanation (Figure
1).
In mining the first issue is the matter of the location
of the natural
resource. As it happens salt deposits underlay much of the Michigan
Basin
and extend all across the Midwest into New York State. Anywhere in this
region "straight down" carries one back in time. Nearly one quarter of
a mile under Detroit we are brought back 390 million years into the
Paleozoic
Era to a Silurian Sea in which deep salt deposits were made in a series
of layers now covered with shale, limestone and sandstone overburden.
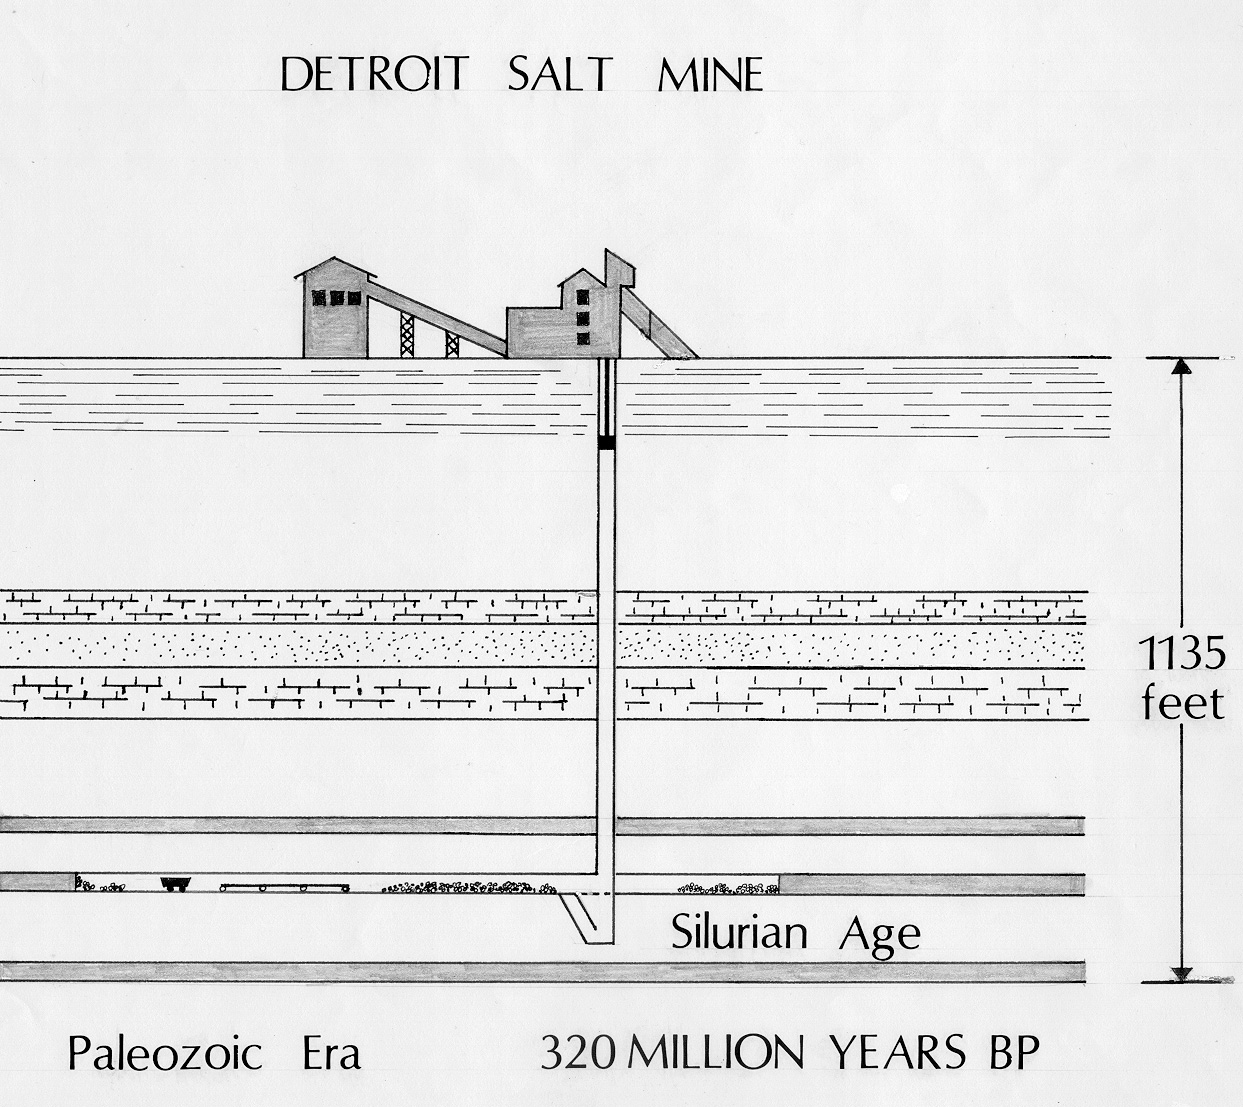
The
Detroit salt mine worked a 30 foot thick seam of rock salt at 1135'
below
the surface, one of several layers of salt (Figure
2). The top 90 to 100 feet from the surface is
unconsolidated
glacial drift full of water under high pressure and permeated with
hydrogen
sulfide. This proved to be a difficult mix of material through which to
drive a mineshaft.
The mineshaft was started in 1906 eleven years after the
salt was discovered
under the city. The mineshaft proved very difficult to dig and eight
men
lost their lives in the effort. By 1914 after bankruptcy and
acquisition
by a rival salt company the mine began production and shortly reached a
production of about 10,000 tons per year. A second larger shaft 16 feet
in diameter was sunk in 1922. Despite this width the largest opening is
only 6 foot by 6-foot square as room for ventilation, the salt skips
(the
containers to lift the salt), power lines, elevators for men and
equipment
must all fit in the shafts. Both shafts were used. Large diesel trucks,
front loaders, drilling rigs, conveyor machines, milling machine and
machine
shops to maintain them are all underground brought down the narrow
shafts
in pieces and even cut into pieces by acetylene torch and reassembled
underground.
At a regional scale the location of the mine may be
taken as market
oriented. Because the resource is spatially ubiquitous, that is,
available
anywhere in the Midwest, proximity to the highest market potential
dictates
choice of location, hence the metropolitan location. There are only
four
rock salt mines in the northeast quarter of the country. Each is in a
metropolitan
area with an upstate New York site as an exception. The cost of sinking
the shafts appears too great for widespread use. For some decades there
has been an alternative to open shaft mines. Brine wells are more
common.
In such installations the salt is removed by pumping hot water into the
salt bed and withdrawing brine. Large Midwestern industrial users such
as chemical companies can sink their own brine wells and are no longer
customers for the rock salt mines. The overwhelming proportion of the
rock
salt is used to clear road of ice during winter months. That market is
seasonal and varies with the severity of the winters. As it is always
more
efficient for an industrial operation, including mining, to have steady
production, the older, closed parts of the salt mine are used for
storage
of processed salt. Storage is a time transfer process. The mine is very
dry which means that the stored salt does not deteriorate over
time.
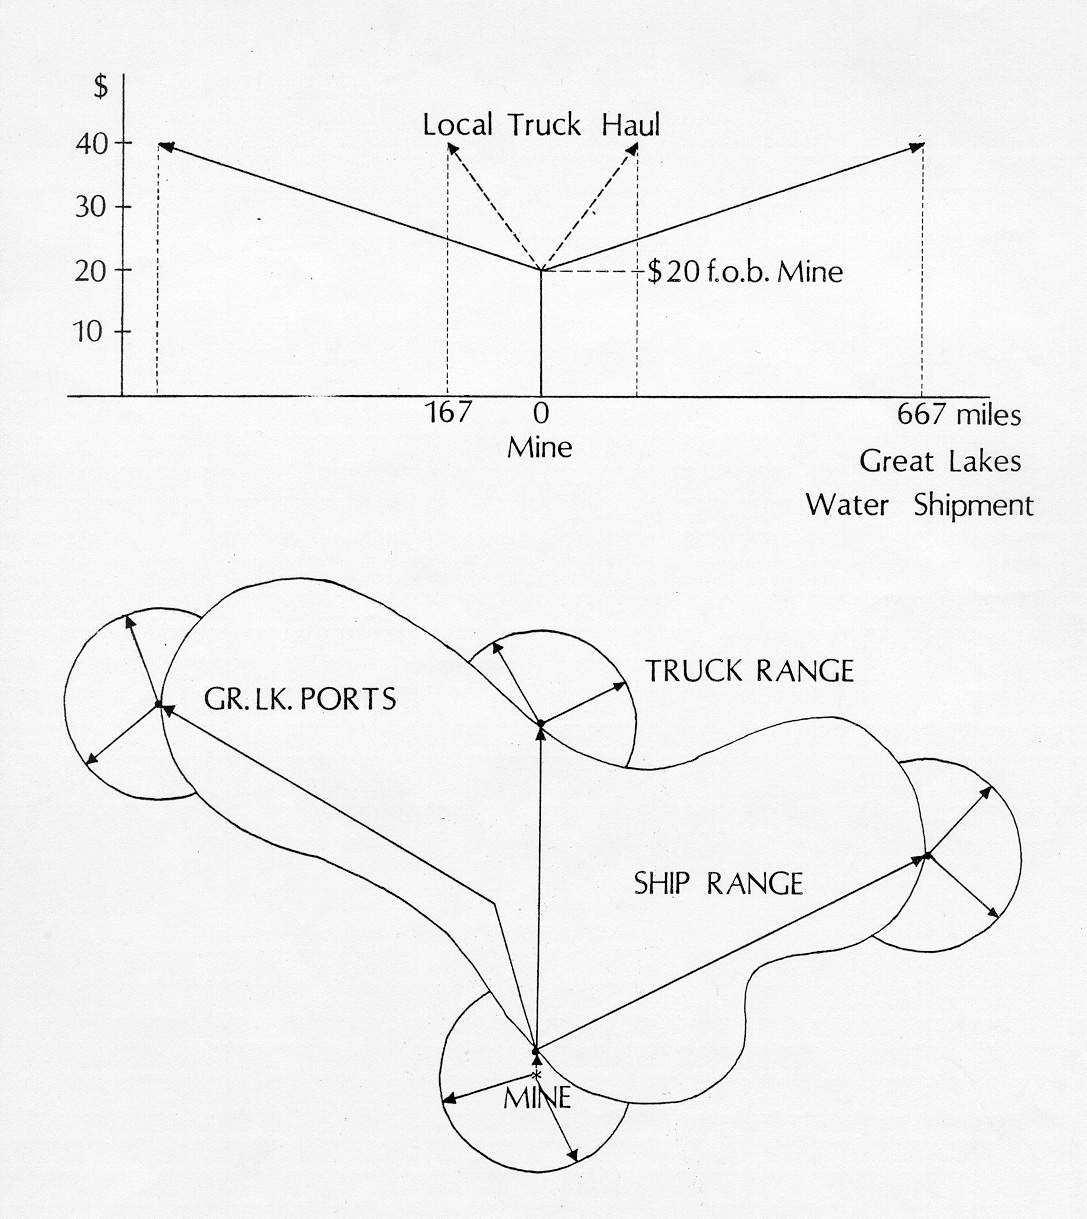
The salt sells for about $18 to $20 per ton f.o.b. the
mine. (f.o.b.
means free on board--the customer pays for hauling it away). The mining
company sells either f.o.b. or delivers and adjusts the price
accordingly.
They lease or contract for trucks from hauling companies when they
offer
to deliver. Transportation costs vary by size of truck, 25 cents per
ton-mile
for trucks with 10 to 15 ton capacity down to a minimum of 12 cents per
ton-mile for truck/trailer rigs with 55 to 60 tons capacity. Great Lake
carriers are much less, perhaps 3 cents per ton-mile. At these prices
it
doesn't take much distance to double the price of the salt: 167 miles
by
truck, 667 miles by water (Figure
3). The diagram gives some sense of when customer,
principally
municipalities, county and state road maintenance departments, will
forego
salt and turn to sand and plows to some other alternative to clearing
streets
in snow emergencies.
In 1960, the International Salt Company opened a new
rock salt mine
in Cleveland. It is located exactly on the shore of Lake Erie. This
location
has both logistical and institutional advantages. They are able to ship
salt in bulk by lake carrier at much reduced costs per ton-mile than
overland
shipments. Cleveland is able to ship salt past Detroit to lake ports in
the upper Great Lakes at costs lower than it could be delivered from
the
Detroit mine. The Detroit mine has shipped by water in the past and is
not much more than one-half mile from the turning basin of the River
Rouge
where they have loading facilities. This half-mile gap must, however,
be
bridged by trucking and loading costs that exceed the cost of the
sixty-eight
nautical mile shipment from Cleveland. The Cleveland mine also, by
mining
out under Lake Erie, leases mineral rights from a single owner, the
State
of Ohio. This permits a more efficient mine layout. In 1987 the Detroit
mine ceased to operate, put out of business in part by its awkward
shape.
The Detroit Metropolitan area now gets its salt from Cleveland and
Windsor,
Ontario, where in the later location the mine is of optimal shape and
extends
out under the Detroit River on the Canadian side. In Canada, mineral
rights
laws were more favorable to the salt companies.
Site Conditions. Pure salt crystals make a very
hard rock and
hard rock mining techniques must be employed in the mine. The active
mine
face is undercut ten feet, (the undercut is called a kerf), powder
holes
drilled and the rock salt blasted free. Very large trucks, primary
crushers,
conveyor belts and milling machines all underground, are used to create
the finished rock salt graded by several sizes. Up to twenty-five
percent
of annual production can be stored in the empty rooms of the mine
(200,000
to 250,000 tons) as annual productions of up to one million tons are
mined
in normal years. The active face of the mine is 23 to 25 feet high and
50 to 60 feet wide. Eight hundred to nine hundred tons of salt are
freed
in each shot. Salt weighs about one ton per cubic yard in place. The
seam
being worked yields about 40,000 tons per acre of recoverable salt.
These
dimensions are important when we turn to considering technological and
institutional scale effects in the mining operation. Long rooms, fifty
feet wide and twenty-five feet high are formed by the mining
operations.
Huge salt pillars sixty by eighty feet on a side are left in place to
hold
up the roof. The salt is strong enough that no shoring is necessary. No
cave-in has ever occurred. This type of hard rock mine is called
"pillar
and room" (Figure
4). Sixty-two percent of the salt is recovered using
this method. The mine has been operating since 1914. Something like
1700
acres have been excavated. Figure 1 shows a plane view of the mine as
it
exists today. These boundaries are not exact because the mine managers
were reluctant to release a map of the mine to me for reasons that will
become obvious as I continue this story. Notice the irregular shape of
the mine and that it extends essentially only westward from the
mineshaft.
This does not make sense technologically. Logistics are a big part of
the
mining costs and logistically the best shape would be compact, nearly
circular
with the mineshaft at the center. Two transport technologies are
employed
underground, trucks costing at best perhaps 20 cents per ton-mile and
conveyor
belt at perhaps eight cents per ton-mile. The spatial problem is to
minimize
the sum of these two costs from the active mine face to the shaft. The
radius of a circle of 1700 acres is 0.92 miles. The active mine face is
currently over four miles away: 434% farther than the ideal. If half
the
distance were by truck and the rest by conveyor belt this distance
would
cost 35.3 cents per ton more than the ideal. For 800,000 tons per year
that is an additional $280,000. So why does the mine have this shape?
The
answer is institutional and relates back to that concept of the kernel
of existence.
This permits a more efficient mine layout. In 1985 the
Detroit mine
ceased to operate, put out of business by its bad shape. The Detroit
Metropolitan
area now gets its salt from Cleveland and Windsor, Ontario, where in
the
later location the mine is of optimal shape and extends out under the
Detroit
River on the Canadian side. In Canada, mineral rights laws were more
favorable
for the salt companies.
Mineral Rights and Transaction costs. In Michigan
every landowner
having free title to his or her land owns the mineral rights for all
minerals
beneath it. The salt company will offer around $2000 per acre for
mineral
right or about $0.05 per ton. This is highly variable depending upon
the
size and strategic position of the property under consideration. Under
some circumstances the company might be willing to buy the land
outright
only in order to obtain the mineral rights. In other circumstances
mineral
rights would be worth very little. The size and location of the
property
is the key to its value. This can be understood through analysis of
institutional
factors. There is a minimum transaction cost associated with each
mineral
rights transaction. First negotiations must be made, and upon
agreement,
the transfer or leasing of mineral rights must be assigned in each
property
deed and recorded at the county court house records office. If two
lawyers
are involved, one for each side, there exists a minimum institutional
friction
for each transaction that in a rock bottom estimate would total more
than
one thousand dollars at ninety to a hundred dollars per hour per lawyer
for a day or day and a half of work. It could be much more. If the
legal
fees were $1200, this translates into all the value of the mineral
rights
for a lot just under a two-thirds of an acre in size. Most city lots in
high-density residential blocks are 1/8 to 1/6 of an acre in size. The
mineral rights for a lot 1/6-acre in size are worth perhaps $333. Would
you like to sell your mineral rights to the salt company? Never mind
that
your lawyer would probably get most of this payment.
There is another problem. Time as well as space is
involved. For security
in continuity of operations the company is interested in procuring
mineral
rights ten years or more in advance of actual use. That means that they
are not willing to pay more than the present worth for the mineral
rights
they will use in ten years. For a lot that has about $400 worth of
mineral
rights--a lot 91 feet on the side or just under 1/5 acre, the present
worth
at 5.5% interest rate is $234 -- perhaps under two hours of a lawyers
time.
Under these conditions, the salt company preferred to take options on
the
mineral rights and promise to pay royalties whenever they actually
mined
under your property. Under this arrangement they were willing to offer
to pay $2000 per acre in ten years or so, and to make cash payments as
the salt is mined. The seller needed to evaluate this option based on
the
present worth of that future payment using the same interest formula.
For
both parties the transaction costs (i.e., the lawyers' fees) had to be
paid up front. There were also some accounting expenses associated with
this procedure and again it did not pay to deal with small
landowners--the
mining company was not interested in anything under an acre, in fact,
deals
involving several acres at a time are clearly preferable. Therefore
residential
land use marks the limit to the mining activities. This is abundantly
clear
from looking at the map. The shape of the mine is understandable when
considering
institutional constraints in addition to technological ones. Although
the
mine management did not discuss the matter with me, some simple
calculations
are sufficient to give a sense of the minimum property size a
metropolitan
mining company would be willing to consider for acquiring property
rights.
The present value of $2000 for each acre of mineral rights to be used
in
ten years is $1171 at 5.5% interest. If legal and closing costs were to
be kept at, say 5% of total mineral rights costs, then supposing an
efficient
law firm could handle the matter in one day, $800 worth of legal fees
in
current money would require a $16,000 transaction to be attractive to
the
mine operators, ($800 = .05P, P= $16000). The figure $16,000 divided by
$1170.86 (present value per acre) yields 13.7 acres at 5.5% interest
and
22.8 acres at 11% interest. The salt company would not be interested in
any place under twelve or so acres with more normal interest rates and
nothing under twenty-two acres given high interest rates characteristic
of the 1980's unless some special strategic location existed that might
affect mine operations. Both a unit space and a time duration, twelve
acres
and ten years, can be seen to affect the overall dimensions and actual
shape of the mine.
There are more subtleties. Space and time combine to
create velocity.
The velocity at which things happen affects geographic patterns as
well.
Twenty acres are mined in a typical year amounting to 800,000 tons of
salt.
The tonnage must move from the active face of the mine to the shaft.
Some
time ago the company negotiated a purchase of mineral rights from a
group
of small lot owners in which all had to agree to the sale of their
mineral
rights or no deal was to be made. The plan was to cut off about 3000
feet
of underground travel route to reduce underground transportation costs.
Diesel trucks with 22 ton load capacities are used underground along
with
conveyor belts. I estimate the diesels may cost 20 cents/ton-mile (I
did
not have exact figures from the salt company). A saving of 3000/5280 of
a mile at 20 cents/ton-mile would be 11.4 cents per ton. A similar
saving
if the conveyor system were extended through the bypass would be 4.5
cents
per ton. At 800,000 tons per year the savings in truck operating costs
would be $91 thousand per year. An amount of $36 thousand would be
saved
if the conveyor system were shortened by this much. The bypass opened
up
approximately one-quarter square mile (160 acres), which if mined at
about
20 acres per year would mean eight years of operation. What is the
present
worth of a stream of income (savings) of $91 thousand per year for
eight
years? The interest formula for an annuity or stream of savings for
this
period yields a present value of $576,000.
The bypass involved extending mining operations down a
residential street
where property owners on both sides owned the mineral rights to the
center
of the street. A corridor 200 feet wide and 1900 feet long was sought.
The by-pass corridor is shown in Figure 1 located on the north side of
the central part of the mine. It makes the shape of the mine more
complex
topologically by creating a hole in the shape. The corridor contains
8.17
acres. Using the truck technology, the by-pass was worth $70 thousand
per
acre in savings. The strategic location was thus worth thirty-five
times
the usual mineral rights payments. To realize this fact one must
account
for the effects of space and time simultaneously, that is, by
considering
the velocity of activities. Gross sales at twenty dollars a ton and
800,000
tons
per year amount to sixteen million dollars. Savings of $91,000 by
better
spatial arrangement within the mine amounts to one half percent of the
gross per year. I have no idea what profit margins for a mine of this
sort
amount to, but I suspect five percent of gross might be generous.
Perhaps
the corridor was worth ten percent of profits per year. It pays to pay
attention to geography. The prospects for the mine are good insofar as
acquisition of property rights are concerned. The mine abuts parcels
that
exceed ten acres in size at several points on its perimeters. These in
turn open up to territory several times the area that has been mined up
to the present. The access was greatly improved once they acquired
mineral
rights under a railroad right-of-way and more recently under the
Interstate
Highway in the City of Allen Park. These linear forms create many links
to large parcels under various industrial properties in these
communities.
I conclude that the mining company had opportunities for acquiring
mineral
rights sufficient to carry them well into the next century. The outside
dimension and shape of the mine can thus be seen to be a function of an
elementary element that would be no smaller than ten acres and which,
in
turn, depended upon institutional factors interacting with logistical
considerations.
Certain strategic locations might be exceptions.
Metropolitan salt mining may seem to be a rather special
topic but I
detect a generalization here that sheds light on how spatial and
temporal
parameters can be used in understanding other urban patterns. I have
thought
it odd that high-density town house developments have sprung up at the
edge of metropolitan regions and unfortunate also because of the
increase
in travel effort this pattern creates. I suspect that changes in
construction
costs and in the working of the financial market have increased the
size
of minimum viable developments to the extent that suitable large
properties
can only be found on the edge of the metropolitan areas. The urban
region
is a mosaic, made up of discrete elements and not a continuous surface
as is implied in certain urban models. When a system is made up of
discrete
units the minimum viable unit space for an activity affects the larger
dimensions of the activity and should enter into calculations used to
explain
the general patterns.
In spatial terms alone the key variable is density of
the activity measured
in dollars per unit area. In temporal terms the key variable is the
annual
return on initial investments and transaction costs measured as an
intensity
or dollar amount per unit of time. In simultaneous space and time the
measure
is dollars per unit area per unit time. Where/when there is a moving
front
as in the case of metropolitan mining or subdivision expansion, the key
variable is a velocity or rate of advance. In discrete space/time, one
must take into account an appropriate estimate of the minimum extent
and
duration of all elementary elements (kernels) in the system and their
interactions.
References:
Rodolfo J. Aguilar (1973) Systems Analysis and
Design in Engineering,
Architecture, Construction and Planning, Englewood Cliff, N.
Jersey:
Prentice Hall, Inc.
Hagerstrand, Torsten (1970) "What about people in
Regional Science?" Papers, Regional Science Association, v. 24,
pages
7-21.
International Salt Company (1971) Salt City Beneath
Detroit (brochure).
I extend thanks to Mr. Jim McDonald, the Manager of
these mines, for
the information he shared with me about their operations.
"Metropolitan Mining: Institutional and Scale Constraints on the Salt
Mines of Detroit", paper presented to the Northeast Regional
Science
Conference, Hunter College, New York City, May 7, 1983.
A version of the paper was also presented by the
author as part
of a
lecture entitled: "Place, Location, Time and Timing: Form and Texture
in Space/Time" given as the Reginald G. Golledge Invited Lecture,
Department
of Geography, University of California, Santa Barbara, April 8, 1999.
|
|
ANIMAPS III: COLOR STRAWS, COLOR VOXELS, AND COLOR RAMPS
Sandra L. Arlinghaus
The University of Michigan
and
William C. Arlinghaus
Lawrence Technological University
BACKGROUND
Background is important not only in color
visualization
but also in fostering a deep understanding of a variety of abstract
concepts.
One place to begin any background study of color is with the four-color
problem (now, "theorem;" Appel and Haken, 1976). For centuries,
mathematicians
have concerned themselves with how many colors are necessary and
sufficient
to color complicated maps of many regions. (Two regions are said to be
adjacent, and therefore require different colors, if and only if they
share
a common edge; a common vertex, alone, is not enough to force a new
color.)
The answer depends on the topological structure of the surface onto
which
the map is projected. When the map is on the surface of a torus
(doughnut)
seven colors are always enough. Surprisingly, perhaps, the result was
known
on the torus well in advance of the result for the plane (then again,
the
plane is unbounded and the torus is not). The same number of colors
that
work for the plane will also work for the sphere (viewing the plane as
the sphere with one point removed). However, it was not until the last
half of the twentieth century, aided by the capability of contemporary
computing equipment to examine large numbers of cases, that the age-old
"four color problem" became the "four color theorem." Appel and Haken
(1976)
showed that four colors are always enough to color any map in the plane
(hence the University of Illinois postage meter stamp of "four colors
suffice"
announcing this giant result).
The world of creating paper maps and publishing
them
has traditionally been one that is black and white: color processing is
expensive and often has been prohibitive. Nonetheless, cartographers,
photographers,
and others have developed a number of strategies for considering color,
independent of how many colors suffice to color a map in the plane.
Indeed,
Arthur Robinson noted (Robinson, 1960, p. 228),
"Color is without a doubt the most complex single medium with
which
the cartographer works. The complications arise from a number of
circumstances,
the major one being that even yet we do not know precisely what color
is. The complexity is due to the fact that, so far as the use
of color
is concerned, it exists only in the eye of the observer."
Like the mathematician, the cartographer, too, has significant unsolved
problems associated with the concept of color.
Thus, color choice and use is typically tailored
to "standard" reactions, by a typical observer, to color. The effect of
color on an observer is often captured using the following terms as
primitive
terms: hue, saturation, and luminosity.
- Hue is the term used to describe basic color. Blue, red, and
green are
all hues. White light passing through a prism is broken up into the
spectrum
of the rainbow composed of a variety of hues. The basic hues evident in
this process are often referred to as spectral hues and these can be
used
to generate a progression of interstitial hues to fill in between the
evident
hues.
- Saturation is a measure of the amount of hue in a color; it is
also referred
to as intensity. Thus brilliant colors are more intense than are light
pastels.
- Luminosity is a measure of relative lightness or darkness of a
color. Color
can be matched against a gray scale to make this measurement. One would
expect, for example, that most shades of yellow are lighter than most
shades
of red.
In the more contemporary environment of the desktop computer, users of
various software packages in common use are exposed to the
hue-saturation-luminosity
set of primitive terms on a regular basis. In addition, they see the
RGB
(Red-Green-Blue) description also using three primitive terms and the
printer's
(photocopier's) environment of separations into layers based on CMYK
(Cyan-Magenta-Yellow-Black).
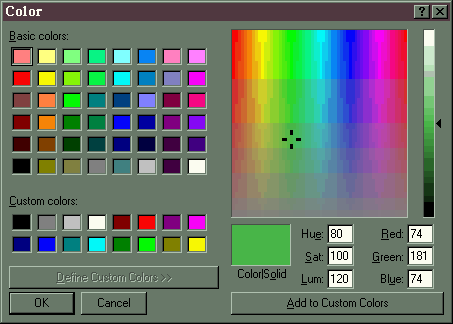
A color wheel (
Figure
1)
can help the user to design strategies for color change: to decrease
magenta,
for example, subtract magenta, or add cyan and yellow (opposite from
magenta).
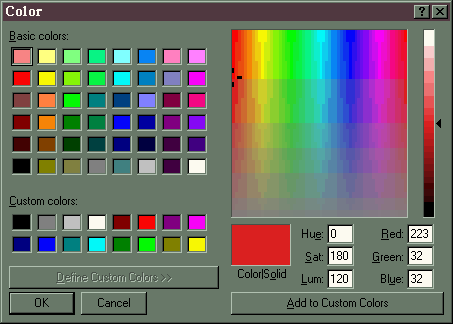
COLOR STRAWS AND COLOR VOXELS
One obvious way to look at color, given two sets
of primitives each with three elements, is as an ordered triple in
Euclidean
three-space. Indeed, that is how color maps are set up in contemporary
software such as Netscape, Microsoft Office, and so forth. Hue is
measured
across a horizontal x-axis (Figure 2) and saturation is measured along
a vertical y-axis (Figure 3). The result is a square or rectangle with
vertical strips of color corresponding in order to the pattern on the
color
wheel. A third axis of luminosity (a gray scale) is often seen as a
strip
to the right of this square (Figure 4). It serves to match the selected
color against light/dark values.
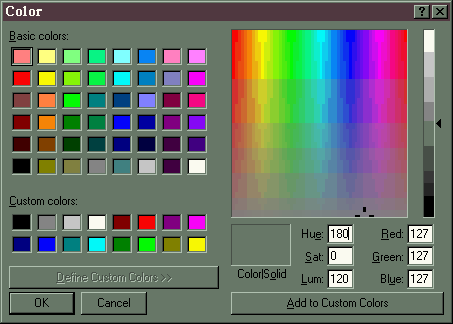
Figure 2. Animated
color map:
shows
change in resulting hue as one moves across the x-axis.
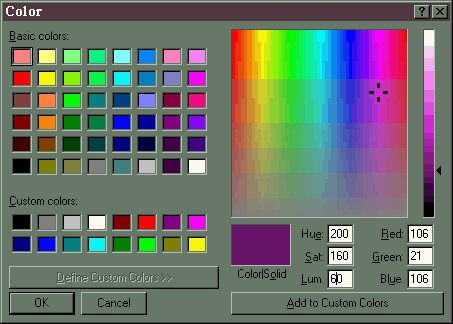
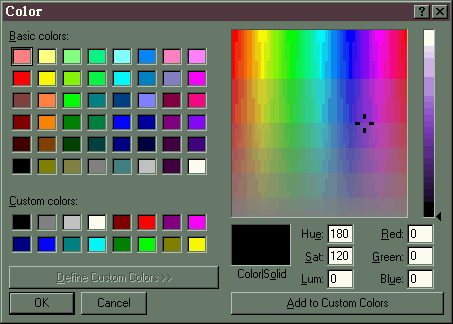
Figure 3. Animated
color map: shows
change in resulting saturation as one moves along the y-axis.
Figure 4. Animated
color map: shows
change in resulting luminosity as one moves along the z-axis.
These animated color maps fix two dimensions and allow a third one to
vary.
That variation shows up in the small rectangle to the lower left of the
color map and also in "straw" to the right of the plane
region.
In all three cases, hue is the variable mapped on the horizontal axis,
saturation is the variable mapped on the vertical axis, and luminosity
is the variable mapped in the straw to the right. Thus, in Figure
2, luminosity is fixed at 120 as indicated by the small arrow to the
right
of the straw. Saturation is fixed at 180 along the left side of
the
rectangle. Only hue is allowed to vary, as shown in the
progression
of the crosshair movement. The small rectangle to the lower left
of the color map changes in color to show the hue of the current
position
of the crosshair. Thus, to see a hue-straw, one would need
to take all 256 colors available in the flashing rectangle and stack
them
up in order of progression. Similarly, one can allow saturation
to
vary and keep hue and luminosity fixed (Figure 3). When
luminosity
is once again fixed at 120, and hue at 180, a structurally identical
situation
occurs (to that above). To see a saturation-straw, one would need
to take all 256 colors available in the flashing rectangle and stack
them
up in order of progression. The final case, in Figure 4, keeps
hue
and saturation fixed and allows luminosity to vary. Thus, one
imagines
a point in the base hue/luminosity plane fixed at (180, 120) and
variable
height shown in the luminosity straw reflecting changes in the single
color-point
as one alters luminosity. In this latter case, the obvious straw
that appears is in fact the actual luminosity straw sought. In
two
cases, there is no evident straw of color and in the third there is;
visualization
is not impossible but it is made difficult.
An alternate way to visualize all of this
is to think of a cube (in 3-space) of 256 units on a side. Label
the x-axis as hue, the y-axis as saturation, and the z-axis as
luminosity.
Then, draw a plane parallel to the base plane (bottom of the cube) at
height
120. Fix lines at 180 within that plane: one
with
hue=180 and one with saturation=180. These two lines trace the
paths
of the crosshairs, respectively, in Figures 2 and 3. What the
cube
approach also shows clearly is that there are really a set of voxels
(volume
pixels) making up the cube: there are 256 straws available for
each
of the three variables. Since 256=2^8, there are therefore 2^8 *
2^8 * 2^8 = 2^24 = 16,777,216 voxels within the color cube (note the
reliance
on discrete mathematics and discrete structuring of a normally
continuous
object).
The notion of looking only at voxel subsets
within a single plane parallel to a face of the cube is limiting within
this large, but finite, set of possibilities. In choosing
sequences
of color there may well be reason to follow a diagonal, to tip a plane,
or to find various other ways of selecting subsets of color, as a
smoothed
color ramp, from this vast array. It is to these possibilities
that
we now turn.
COLOR RAMPS: ALTERNATE METRICS
The problem of finding color ramps
linking
one color to another can be captured simply as follows. To find a
ramp joining two colors, A and B, first represent each of A and B as an
ordered triple in color voxel space. Then, the problem becomes
one
of find a path from A to B. Because one is limited to
integer-only
arithmetic, divisibility of distances often will not be precise; thus,
one is thrown from the continuous realm of the Euclidean metric into
considering
the non-Euclidean realm of the Manhattan metric (of square pixel/cubic
voxel space). Algorithms for finding shortest paths between two
arbitrary
points using integer-only arithmetic will therefore apply to colors
mapped
in color space as well as to physical locations mapped on city
grids.
To see how these ideas might play out with colors, we consider an
example
that will lead to an animated color ramp.
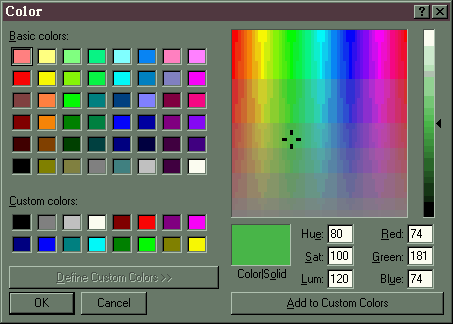
Find a path through color voxel space from (80, 100, 120), shown
below
as a medium green
to (200, 160, 60), shown below as a fairly deep purple.
One set of points through which to pass, spaced evenly (not always
possible),
is given in the table below. The left-hand column shows values of
hue, the middle column values of saturation, and the right-hand column
values of luminosity.
| 80 |
100 |
120 |
| 90 |
105 |
115 |
| 100 |
110 |
110 |
| 110 |
115 |
105 |
| 120 |
120 |
100 |
| 130 |
125 |
95 |
| 140 |
130 |
90 |
| 150 |
135 |
85 |
| 180 |
140 |
80 |
| 170 |
145 |
75 |
| 180 |
150 |
70 |
| 190 |
155 |
65 |
| 200 |
160 |
60 |
Figure
5 shows an animation using the path
outlined
in the table above. The crosshairs show the movement along the
path
while the flashing color in the rectangle below the color map shows the
associated color ramp. Clearly, the choice of path is not
unique:
geodesics are not unique in Manhattan space. From this analysis,
we see that the following theorem will hold.
Theorem.
The determination of color ramps joining two colors is abstractly
equivalent
to finding paths in Manhattan space between two arbitrary points (where
geodesics are not unique).
One might wonder what would happen when other
color
characterization schemes are considered. We suspect that a
similar
analysis will follow. For, in a related, but not identical,
manner
the RGB scheme may also be represented as describing color using
3-space.
In that scheme, the gray scale comes out as a 45 degree diagonal.
Computer
scientists offer a color code containing six alpha-numeric characters,
appearing in pairs of hexadecimal code that also serve as a 3-space.
Generally,
though, the various schemes offer only visual slices through this
three-dimensional
color space along axes or in other "expected" ways. Different vantage
points
offer different perspectives, however. Pantone color formula guide
books
offer one physical set of straws by which to probe 3D color space. The
theorem above offers a comprehensive mathematical set.
REFERENCES
Appel, K., and Haken, W. A proof of the 4-color theorem. Discrete
Mathematics, 16, 1976, no. 2 (and related references).
Arthur H. Robinson, Elements of Cartography, 2nd
Edition,
1960. New York: Wiley.
RELATED LITERATURE
Sandra L. Arlinghaus, William C. Arlinghaus, John D. Nystuen.
The Hedetniemi Matrix Sum: An Algorithm for Shortest Path and
Shortest
Distance, Geographical Analysis, Vol. 22, #4, Oct. 1990, pp.
351-360.
Sandra L. Arlinghaus, William C. Arlinghaus, John D. Nystuen.
The Hedetniemi Matrix Sum: A Real-world Application, Solstice,
Vol. I, No. 2, 1990. http://www.imagenet.org
Sandra L. Arlinghaus, William C. Arlinghaus, John D. Nystuen.
Discrete Mathematics and Counting Derangements in Blind Wine Tastings,
Solstice,
Vol. VI, #1, 1993. http://www.imagenet.org
Sandra L. Arlinghaus, William C. Arlinghaus, Frank Harary, John D.
Nystuen.
Los Angeles 1994--A Spatial Scientific Study, Solstice, Vol. V, #1,
1994.
http://www.imagenet.org
BOOK REVIEW
Andre I. Khuri, Thomas Mathew, and Bimal K. Sinha, Statistical
Tests for Mixed Linear Models, John Wiley & Sons, 1998, 352
pp., $69.95 (cloth).
The decomposition of variance components is an essential part of
data analysis for researchers employing mixed models i.e., those
containing both fixed and random effects. In recent years, analysts
have made significant breakthroughs regarding statistical tests for
such models. Statistical Tests for Mixed Linear Models, written
by André Khuri and his co-authors, presents a
comprehensive,
mathematical overview of these methods and extends past work to include
hypothesis testing.
Traditional, analysis of variance (ANOVA) models are well developed
for fixed effects models, which are those in which the researcher has
complete control over assignment of factors and factor levels. For
models with random effects (as often exists in observational studies,
where for example, subject educational level varies but is not under
the control of the researcher), too, ANOVA models have long existed.
Models with both types of effects, however, present some special
challenges, and Statistical Tests for Mixed Linear Models lays
out appropriate solutions.
Covering both balanced (those with equal numbers of observations in
all subclasses) and unbalanced models (those with at least one subclass
with a different number of observations compared to the others), Statistical
Tests for Mixed Linear Models
presents derivations of both exact and optimal tests for variance
component models, as well as guidance on using such tests for
hypothesis testing. While little attention is paid to conducting such
tests with commonly available statistical software (e.g., SPSSTM
or SASTM) in
many instances such software cannot directly perform the tests
described -- the authors usually provide sufficient information to
allow
users (especially advanced users) to complete the tests on their own,
generally aided by specific output given in standard ANOVA tables. In
several places, conceptual algorithms are given to allow the reader to
conduct tests not offered in standard software.
Designed primarily as a course textbook, Statistical Tests for
Mixed Linear Models
includes student exercises at the end of each chapter, an appendix that
gives the solutions to selected problems, and an ample bibliography.
Beyond formal use in the classroom, the book also may serve as a
reference guide for researchers beyond their student years who wish to
know more about exact or optimal tests for mixed linear models.
Interested readers, however, should be aware that this is not an
introductory text on experimental design or ANOVA. To make best use of Statistical
Tests for Mixed Linear Models,
readers should be well versed in both. For a good overview of
experimental research design, see, for example, Montgomery (1991). A
classic work on ANOVA is Scheffe (1959), and many more fine texts have
come since.
For those interested specifically in the optimal tests presented in Statistical
Tests for Mixed Linear Models,
the authors recommend previous familiarity with the concept of optimal
tests and the methods for deriving such tests (such as Lehmann, 1986).
Readers would do well to heed this advice; indeed, Khuri and his
co-authors would have greatly aided their readers had they included an
introduction to optimal tests in Statistical Tests for Mixed Linear
Models.
Viewed as either a textbook or a reference guide, Statistical
Tests for Mixed Linear Models
suffers from one major drawback for researchers who primarily use
statistics (as opposed to statisticians who advance statistical
methods)--too few applications of developed procedures to real data. No
doubt, the almost purely mathematical exposition is not a drawback for
statisticians or mathematicians, but it can be frustrating for those
who want to learn how best to apply advanced methods to actual data.
Working the sample problems may alleviate some of this concern.
Those already comfortable with mixed models will find much of use
in Statistical Tests for Mixed Linear Models. The
tests described therein will enable researchers to make stronger and
more certain inferences from their data. Finally, teachers of advanced
courses in experimental data analysis will have collected in one place
many of the most recent advances in the field.
REFERENCES
Lehmann, E.L. 1986. Testing Statistical Hypotheses, Second
Edition. New York: Wiley.
Montgomery, D.C. 1991. Design and Analysis of Experiments.
New York: Wiley.
Scheffe, H. 1959. The Analysis of Variance. New York: Wiley.
Reviewed by
Richard Wallace
University of Michigan
BOOK REVIEW
Castells, Manuel (1996). The Rise of the Network Society (The
Information Age: Economy, Society and Culture, Volume 1). Malden,
MA: Blackwell Publishers, Inc. (556 pages, bibliography 51 pages, index
23 pages).
Manuel Castells has helped to alter the direction of social
research with such works as The Urban Question (1977) and The
City and the Grassroots (1983). In his latest book, The Rise of
the Network Society
(part one of a three-part series), Castells attempts both to synthesize
decades of intellectual thought (his own and others) and to generate a
conceptul structure to embody the myriad societal changes occurring
worldwide. The book provides a thought-provoking description of the
collective human experience during the current Information Age. While
the book attempts to cover many aspects of the economy, society, and
culture, the most novel aspects of the book, which Castells refers to
as "the architecture and geometry" of the network society, should be of
particular interest to geographers and mathematicians, alike.
Castells begins the book with a description of how the Information
Technology (IT) Revolution is distinct from the Industrial Revolution.
The distinguishing characteristic of the new IT paradigm that
particularly affects social and economic transformations is its
"networking logic". As opposed to the linear or serial set of
relationships during the Industrial Revolution, epitomized by Fordist
mass production, new information technologies are facilitating more
complex interactions that are organized by networks. Clearly, network
structures are not new, but Castells argues that new information
technologies, such as the Internet, allow such structural types to
pervade social and economic processes.
Castells describes how the fundamental aspects of networks allow
for changes that are leading to a variety of transformations, such as
decentralization within firms, telecommuting of workers, interactions
in the virtual community and economic globalization. Networks can
expand without limits by simply integrating new nodes that share the
same means of communication with other nodes. Networks are much more
flexible and malleable, because there is no overarching organizational
or institutional shape.
Building upon his previous research in political economy and urban
sociology, Castells views the current transformations in urban form
around the world as the manifestation of the interconnections and
linkages between cities. The "space of flows," which pertains to flows
of capital, flows of information, flows of technology, etc.,
intertwines the fates of nodes in the network, but does not
predetermine them. Winners and losers in the global urban network are
difficult to predict and are continuously emerging from the space of
flows. Perhaps an example of Castells's view is the economic
uncertainty that ensued after the East Asian crisis in 1997. The path
of the pandemic affected the Pacific Basin, but did not travel to the
US (yet), as widely feared.
Potential future research in planning based on Castells' framework
should center upon the policy implications of the new IT paradigm. When
are local planning initiatives held hostage by the global forces in the
space of flows? Are different networks destined to remain infinitely
apart due to incompatible means of communication? Are there policy
remedies for the segmentation of society based on those who are
networked and those who are not? Geographers and mathematicians will
recognize the applicability of a graph theoretic approach to decipher
complex networks, which may be appropriate for a planning context. Such
methods can, for example, identify critical linkages that would cripple
a section of the network if severed.
Castells interjects several heady topics throughout the book such
as the logic of capital accumulation, the relationship between society
and postmodern architecture, and the social arrhythmia of the natural
lifecycle. The book is written like a very long essay, since Castells
does not provide rival explanations for many of the issues included in
the book. There are also some unclear aspects of his framework. For
example, why do some networks have nodes that dominate flows, as in the
urban network, whereas others do not, as in the Internet? Although
Castells specifically states that "this is not a book about books", the
amount of detail compiled from a wide variety of sources tends to
detract from the originality of his thoughts. For the reader who
already knows about the rise of Silicon Valley and the Latin American
debt crisis, Castells; synopses are redundant. For the reader new to
topics related to the high-technology economy and globalization,
however, this book provides a comprehensive survey of the literature.
The Rise of the Network Society is a book to read
neither quickly nor only once. If time is a limiting concern, however,
the final three chapters, which include a provocative discussion about
space and time in the network society, incorporate the crux of
Castells's vision of society at the turn of the 21st century.
Reviewed by
Seema Desai Iyer
University of Michigan
