
SOLSTICE:

AN ELECTRONIC JOURNAL OF GEOGRAPHY AND MATHEMATICS

http://www.imagenet.org


SUMMER, 1998


VOLUME IX, NUMBER 1


ANN ARBOR, MICHIGAN


Founding Editor-in-Chief:

     Sandra Lach Arlinghaus, University of Michigan;

        Institute of Mathematical Geography (independent)


Editorial Advisory Board:

  Geography.

     Michael F. Goodchild, University of California, Santa Barbara

     Daniel A. Griffith, Syracuse University

     Jonathan D. Mayer, University of Washington (also School of Medicine)

     John D. Nystuen, University of Michigan

  Mathematics.

     William C. Arlinghaus, Lawrence Technological University

     Neal Brand, University of North Texas

     Kenneth H. Rosen, A. T. & T. Bell Laboratories

  Engineering Applications.

     William D. Drake, University of Michigan

  Education.

     Frederick L. Goodman, University of Michigan

  Business.

     Robert F. Austin, Austin Communications Education Services.


Technical Editor:

     Richard Wallace, University of Michigan.


Web Design:

     Sandra L. Arlinghaus

     William E. Arlinghaus.


WebSite:  http://www.imagenet.org

Electronic address:  sarhaus@umich.edu


MISSION STATEMENT

     The purpose of Solstice is to promote interaction between geography

and mathematics. Articles in which elements of one discipline are used to

shed light on the other are particularly sought.  Also welcome are

original contributions that are purely geographical or purely

mathematical.  These may be prefaced (by editor or author) with commentary

suggesting directions that might lead toward the desired interactions.

Individuals wishing to submit articles or other material should contact an

editor, or send e-mail directly to sarhaus@umich.edu.


SOLSTICE ARCHIVES

     Back issues of Solstice are available on the WebSite of the Institute

of Mathematical Geography, http://www.imagenet.org and at various sites

that can be found by searching under "Solstice" on the World Wide Web.

Thanks to Bruce Long (Arizona State University, Department of Mathematics)

for taking an early initiative in archiving Solstice using GOPHER.


PUBLICATION INFORMATION

     The electronic files are issued yearly as copyrighted hardcopy in the

Monograph Series of the Institute of Mathematical Geography.  This

material will appear in Volume 21 in that series, ISBN to be announced.

To order hardcopy, and to obtain current price lists, write to the

Editor-in-Chief of Solstice at 2790 Briarcliff, Ann Arbor, MI 48105, or

call 313-761-1231.

     Suggested form for citation:  cite the hardcopy.  To cite the

electronic copy, note the exact time of transmission from Ann Arbor, and

cite all the transmission matter as facts of publication.  Any copy that

does not superimpose precisely upon the original as transmitted from Ann

Arbor should be presumed to be an altered, bogus copy of Solstice.  The

oriental rug, with errors, serves as the model for creating this weaving

of words and graphics.
Introduction
Spatial analysis is often conducted in a single time slice. One sees thematic maps showing per capita Gross National Product by county for a single year, yet others showing Ph level from soil samples interpolated across an agricultural surface, and still others showing, at the global scale, the association between total fertility rates and level of women's education in developing nations. To be sure, each of these is useful and each offers directions for further analysis that might otherwise go undetected by a student of the data set alone; each can also serve as a baseline map from which to build over time.
How much more useful these, and other maps, can become when change over time and diffusion processes can be tracked in the underlying variables being mapped. A sequence of static maps can be grouped as a single animated file, flipping from one map to the next, with exact overlays. When the animated file is uploaded to the Internet, the reader is offered a unique opportunity, not possible in conventional hardcopy publishing: to have color animated maps at virtually no cost.
Animated maps ("animaps") can be made in specific software packages, such as Microsoft PowerPoint; however, conversion of the file format to one that is readily uploadable to the web will be required (current versions of PowerPoint offer such an option). Another route is simply to use animation software that makes animated files from files in .gif or .jpg format. These packages have the advantage of universality. Any map in a GIS can be exported, for example, to Adobe PhotoShop and saved there in either .gif or .jpg format. The manner of exporting the map from the GIS in which it was created may not always be straightforward (although in most modern GISs it is). When the export process is not obvious, it is always possible to use the command that is universal in Windows (3.0, 3.1, 95, etc.), alt+PrintScreen, to capture an image of the map on the Windows clipboard and paste it into a blank canvas in PhotoShop (cropping the pasted image as required). Universality has many advantages: it offers flexibility to users with many state-of-the-art options and it offers perhaps unforeseen opportunity to users who are still several generations removed from state of the art.
Long-range Planning
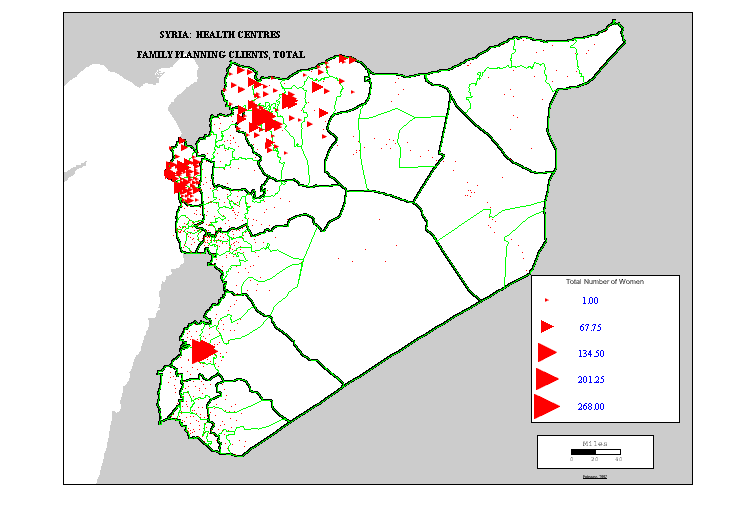
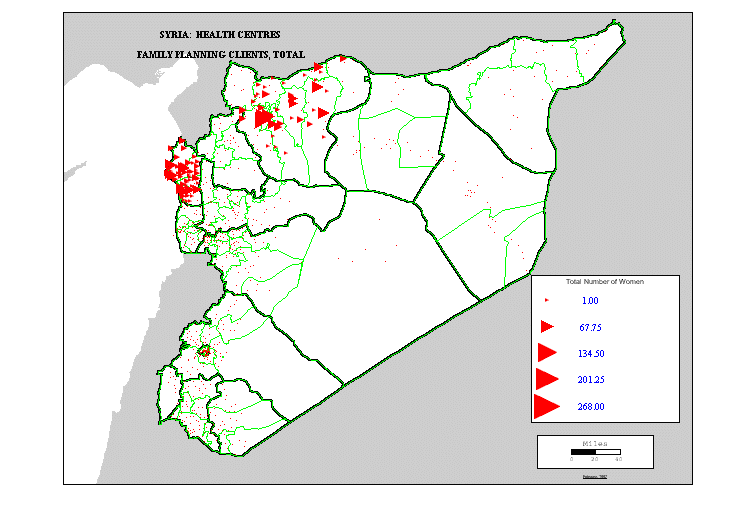
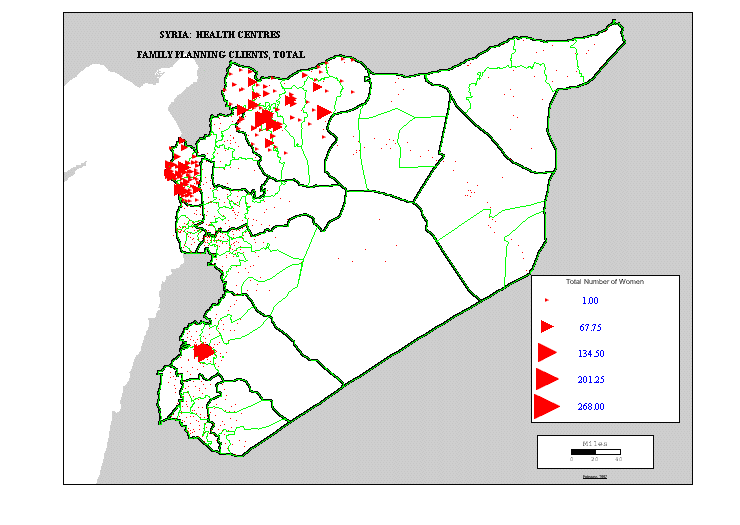
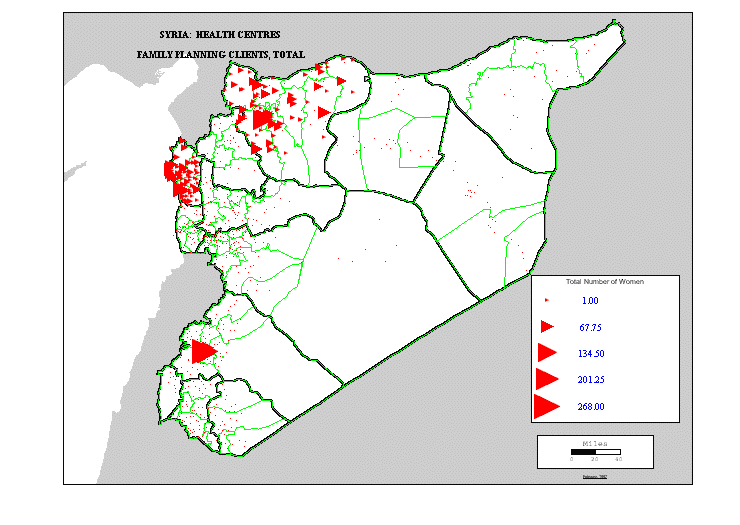
From 1992 to 1996, Community Systems Foundation (501(c)3 corporation) in Ann Arbor developed a Management Information System (directed by Drake and Oswalt) for the country of Syria for UNFPA (United Nations Family Planning Agency). During the course of that project, there were five missions (MCH/FP: Maternal and Child Health/Family Planning) to develop a system for the monitoring and evaluation of health care and family planning at Syrian Ministry of Health facilities (both urban and rural). Among other things, sequences of GIS maps were developed (Oswalt and Arlinghaus) to show distribution patterns of acceptance of various health care practices at various geographic scales: from the highly local to country-wide. Considerable effort was expended in getting best-possible spatial information from field sources. Further effort involved training and education on MIS/GIS use of indigenous personnel, both in-country and in Ann Arbor, with the eventual goal that with mastery of mapping and other software would come independence and the capability for the Syrians, themselves, to continue the process begun with our assistance.
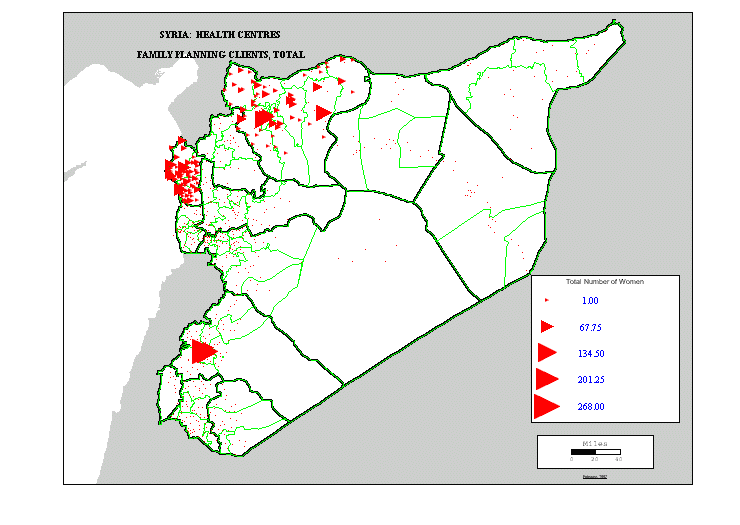
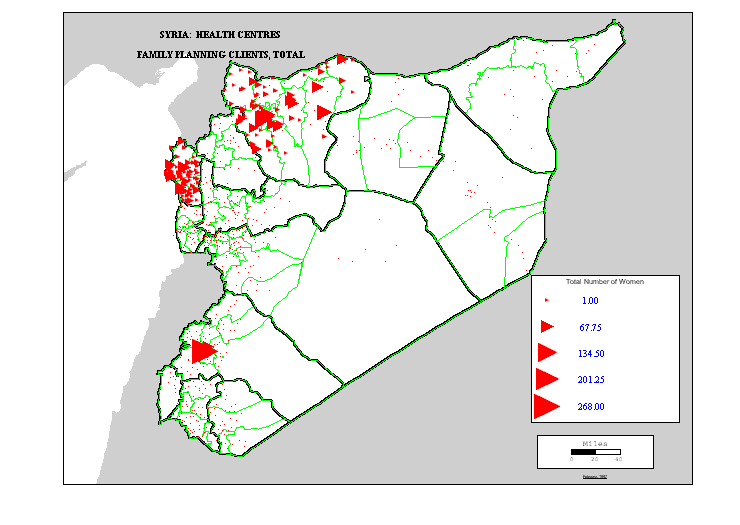
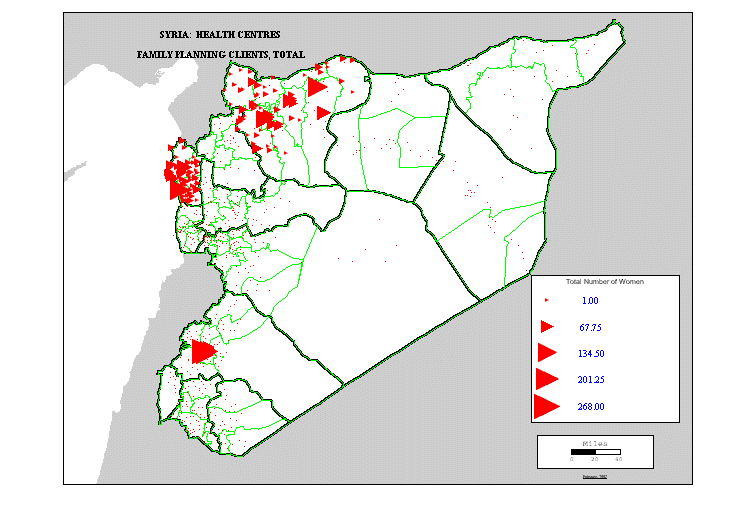
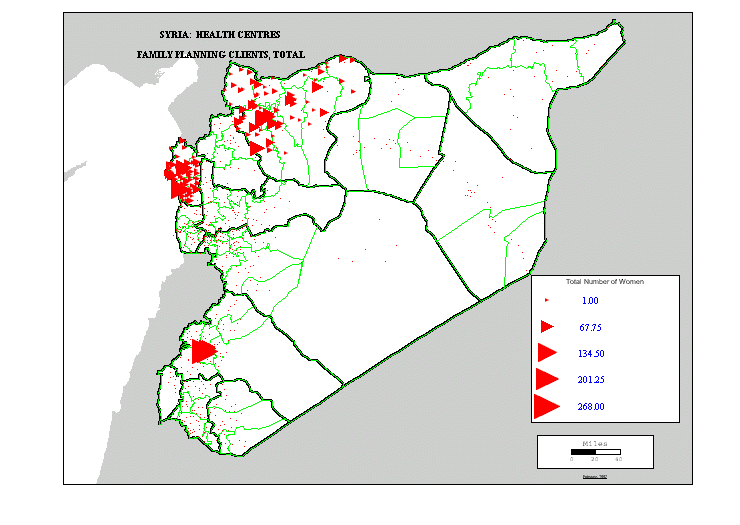
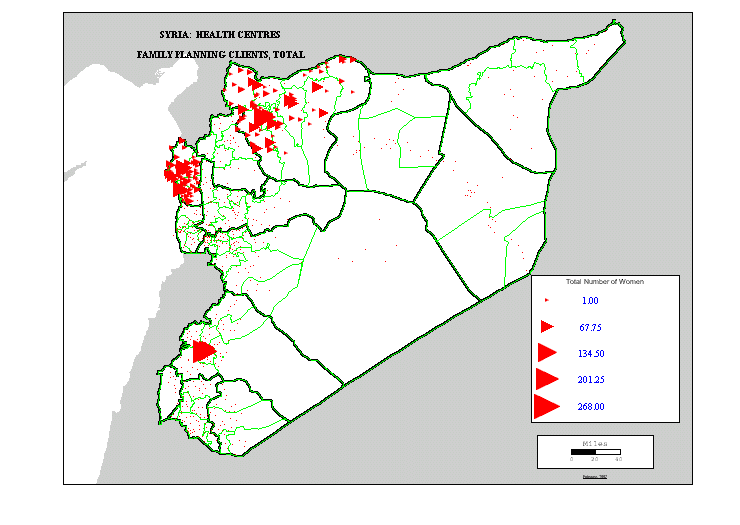
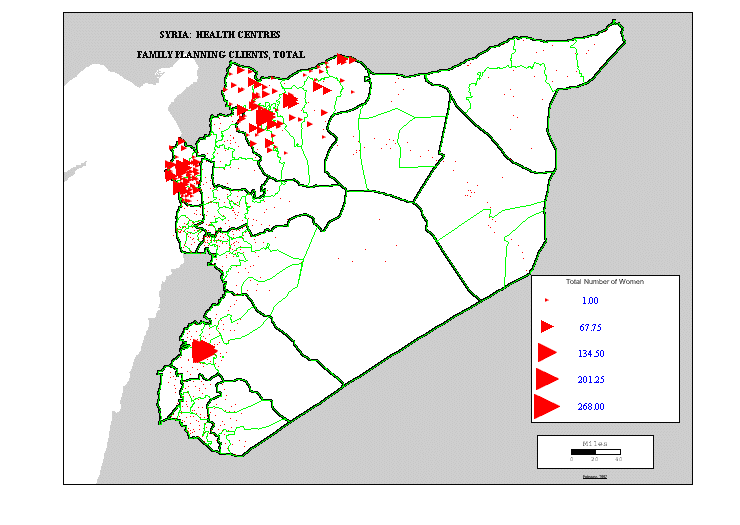
Even in a situation of sparse spatial data, thousands of maps were generated over a period of five years. For the maps to be useful, they needed to become available to a widely scattered audience. What was possible given the state of technology at the time in Syria, was to make a series of wall-map sized posters showing various GIS maps and offering a brief comment next to the map on the poster. When laminated and mounted on the walls in selected Syrian health centers, these maps told a story that the mounds of data collected at those centers never revealed to the workers in the centers. They served as a continuing source of motivation (as they, for the most part, transcended language barriers) and as a glimpse of what the future might bring. It was for related purposes that data accumulated over a fourteen month period was made into an animated map (Arlinghaus, February, 1997). This map compressed volumes of data, of Syrian Ministry of Health data mapped by health center, into a single 20 second file.
Animated map: the small red dots represent Syrian Ministry of Health Centers. The red triangles represent the total number of women visiting the health center in a one-month period. Data sets were from November, 1994 to December, 1995. Because there is no animated legend on this animated map, the single maps are enumerated below by month.
Single maps, by month:
November,
1994
December,
1994
January,
1995
February,
1995
March,
1995
April,
1995
May,
1995
June,
1995
July,
1995
August,
1995
September,
1995
October,
1995
November,
1995
December,
1995
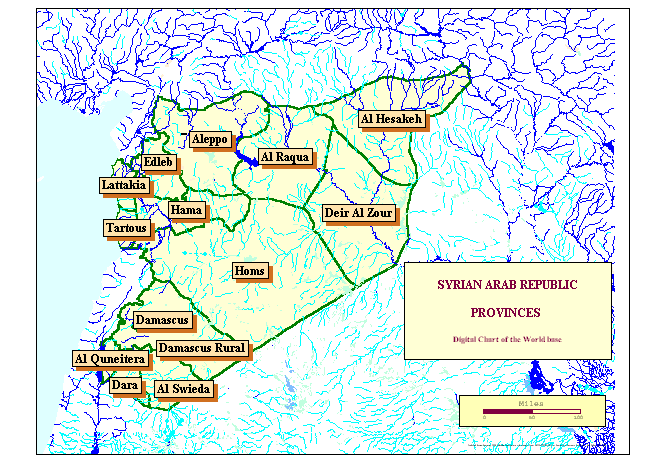
In order to analyze an animated map it can be helpful also to have the individual maps, from which the animation was made, available as well. In the case of the Syrian animap, it appears that, when viewed at the country scale, much of the variation occurs in the province of Aleppo (see reference map for place-name information). Overall, there appeared to be general expansion of acceptance of MCH/FP over time; however, more fluctuation in pattern, from month to month appeared than one might expect. If the expansion is real, certainly the trend as measured by the data is NOT one of steady increase. This observation might lead one to consider the level of steadiness and local cultural preferences in reporting data on a month by month basis. Accumulated data could easily account for the high level of variability. The animation points to one direction for further investigation: that of tracking timeliness of reporting of information.
Global Animap
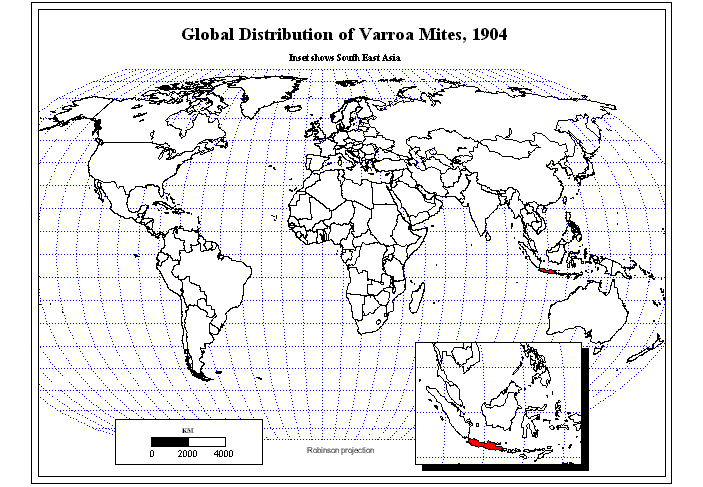
In the case of the Syrian animap, more information might suggest level of significance of observed patterns. In some cases, diffusion, be it of the "infill" or "sprawl" sort, is clearer than it is in others. A few months ago, Nystuen discussed the concern of his colleague in Entomology, Sammataro, in tracking the global diffusion of the Varroa Mite, a pest which threatens the honeybee population. This seemed a good opportunity to press into service the technique developed for Syria of using animaps.
Data was provided for most of the world's countries for much of the 20th century. The same basic strategy as was used for the Syrian data was to be used for the mite data, as well. One additional suggestion (Nystuen) was to alter the interval between images to reflect the uneveness in time points for collecting the data (longer spacing between frames show a wider gap between data observations). Yet another was to have previous data in one color and data relating to the current frame in a different color (Nystuen). We used a simple color selection to track the advancing wave of the varroa mite across the nations of the world. Future work with these maps might involve deeper numerical analysis of the data, as percentages or other, and subsequent remapping (Drake) as the data quality permits.
In this case, the pattern of advance is clear and, unlike the Syrian case, is one of steady increase. Still, one might wonder about variability in the timing of reporting. It is interesting that from early beginnings in Southeast Asia, the initial spread was quite slow. With air travel becoming more frequent, post World War II, the spread of the mite accelerated; indeed, with the more generally interconnected world, the pace of mite diffusion has also accelerated. Whether or not there is a causal connection would need verification. There is, however, an obvious spatial association that is enough to suggest such additional study.
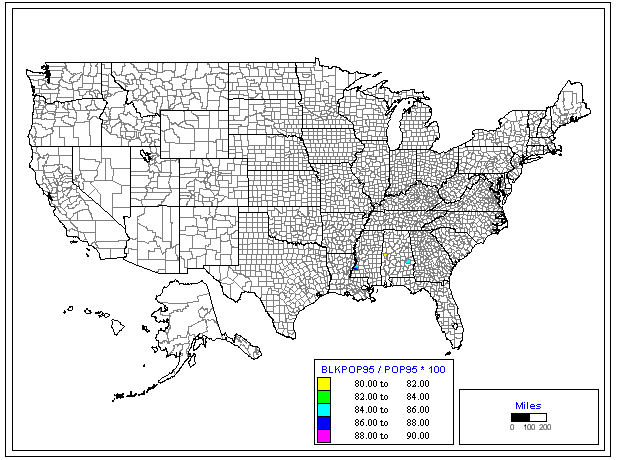
Surrogates for lack of data
Sometimes it is difficult to acquire data over a period of time. With a bit of imagination, one may instead be able to use a surrogate variable to capture easily what might otherwise have been difficult to capture. To illustrate this sort of technique, in a time-dependent framework, consider the following animap. When African-Americans first came to North America, they entered often along the south and southeastern shores of modern-day U.S.A. Over time, population migrated and moved throughout the country. If one considers as a surrogate to having year by year data for that movement, the fact that not many people move over time all that far from their point of entry to the country, then one might capture the temporal movement pattern over centuries by the spatial density pattern at a single time slice. To test this idea from the standpoint of simple mapping, the U.S. was mapped by county according to density of African-American population (1990 Census data). The mapping of this initial test-run was kept simple: the default lat/long framework, rather than a conventional projection, were used in the GIS (Atlas GIS, version 3.03) for eventual ease in switching to other projections. As had Nystuen, Laug wished to color percentages from previous frames all in one color, with percentages in the current frame colored in a different set of colors. She also wanted to track the advancing edge, as had Nystuen, but in addition wanted to see gradations in that edge. There is a tradeoff in clarity; how many categories should one use on the edge?
U.S. African-American Population Density by County, 1990.
The pattern that emerges at this one time slice does appear to mimick the general history of African-American migration in the U.S., over centuries. To have a firmer idea as to the extent to which the internal U.S.migration/density assumptions actually migration to the U.S. over time, a number of additional steps would be required. The animap guides the research direction. Indeed, some of the issues one might reasonably examine involve (but are not limited to)
Animaps display spatial and temporal pattern together in a single .gif file.
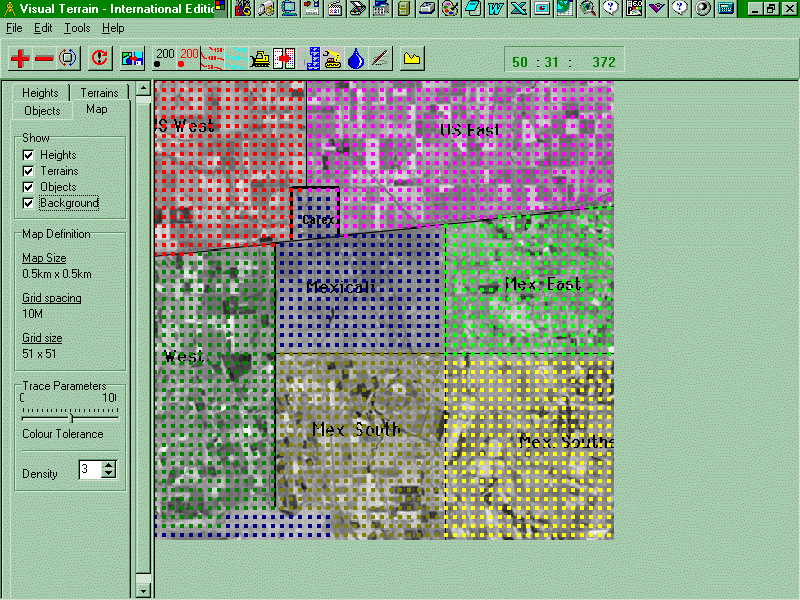
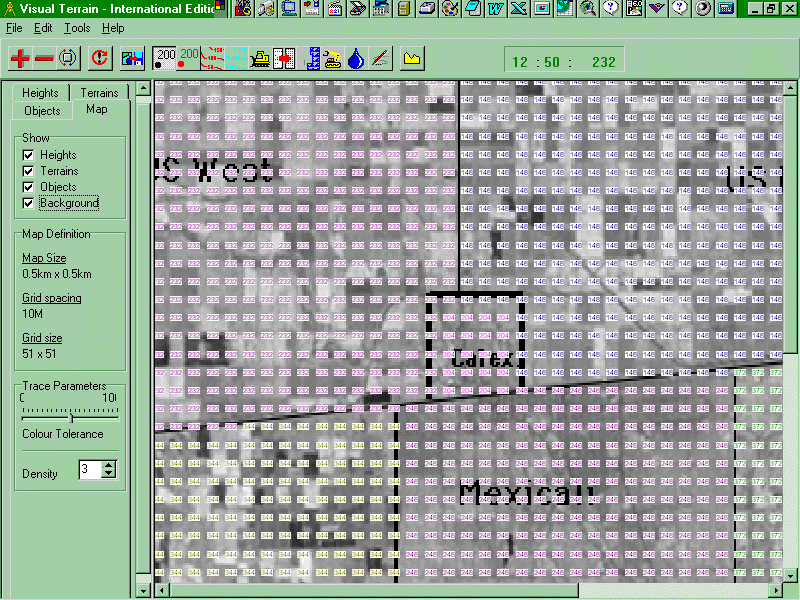
Concerns that involve the "static" and the "dynamic" elements of any issue are ones that endure, independent of discipline. De la Sierra, in looking at fragmentation patterns involving agricultural landuse on either side of the U.S./Mexico border, invokes principles from physics to breathe life back into static satellite photographs of his region of interest (Mapping Entropy, University of Michigan, School of Natural Resources and Environment, Ph.D. Dissertation, 1998). Indeed, there are many ways in which one can revitalize static images and return the dynamic component to them that once was there. Mathematical and scientific models offer one way to do so. Diffusion studies can offer an appealing way to do so when spatial change is measured over time, particularly when the pattern displayed is a simple one in which the eye can grasp changes as one jumps from one image to the next one in time. In the case of satellite photos of agricultural landuse patterns, however, the subtle patchwork quilt that fills the entire cathode ray tube does not lend itself well to being captured by the eye to its full extent. Thus, the eye may miss subtle changes that it would grasp in a scatter of dots when the same diffusion display techniques are used for changes in dot scatter and changes in landuse pattern.
Thus, we offer here a few visual techniques that offer promising ways of reducing the quilt-like landuse pattern to one that is easier to grasp, yet displays the desired information. In the publishing environment of the web, expansive use of color and animation offers opportunities for the display of spatial information previously undreamed of in the conventional publishing environment that traditionally balks even at a few color maps. In the sample below, we exploit various possibilities, beginning with a simple, single black and white Landsat photo.
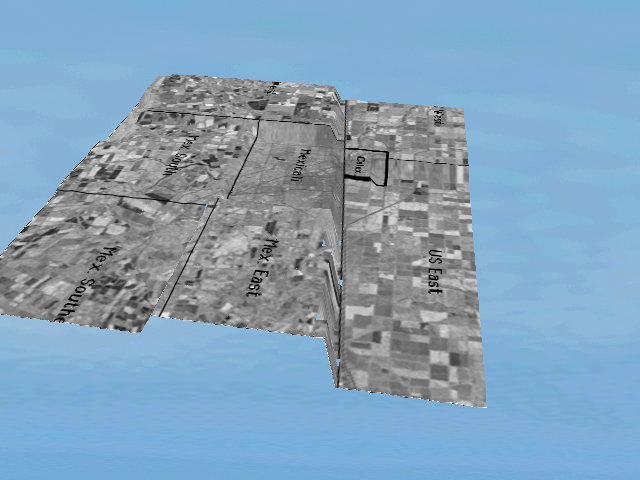
1. LandSat photo (click on this link) of the U.S./Mexico border region. De la Sierra partitions the region into urban and rural areas. The urban area is composed of Calexico on the U.S. side of the border, and Mexicali on the Mexico side of the border. The agricultural areas, he separates into U.S. East and U.S. West and Mexico East, Mexico Southeast, Mexico South, and Mexico West. The designations as to direction are in relation to the urban areas. The method of partition is based on a visual determination of pattern of landuse. Different grouping of parcels would result in different patterns and in different numerical measures (below). To suggest the role that the choice of partition might play, and the need for normalization, we include also values for arbitrary regions (with interpretation left to the reader).
2. Table of entropy values for each agricultural region in the
partition in the image above with non-arbitrary partition.
Mexico East: 1.86
Mexico Southeast: 1.39
Mexico South: 1.49
Mexico West: 1.72
U.S. West: 1.16
U.S. East: 0.73
Total Mexico: 1.73
Total U.S.: 1.02
For regions selected arbitrarily (but including land on both sides
of the border), the values were:
East: 1.76
West: 1.71
Combined total: 1.72
Generally, the measure is based on assessing the amount of disorder that appears in the pattern of agricultural landuse. The Mexico East region displays the greatest amount; the U.S. East region, the least. Readers interested in the detail of definition and calculation are referred to De la Sierra's document. For purposes of display techniques, it is sufficient for the reader to understand that this measure is a relative one, used to compare one region to another and to understand that higher values represent higher disorder in landuse pattern.
3. A square portion of the LandSat photo was saved, using Adobe
PhotoShop
4.0.1 for Windows, as a .bmp file. This bitmap was then used as a
backdrop
in Visual Explorer 1.1 (WoolleySoft, Scotland) and entropy values from
(2) above were entered as "elevation" values for each of the pixels in
the six agricultural regions. Thus, a "topographic"
map is created from the photographic backdrop in which the
topography
is determined by the entropy values. Pixels off the topographic surface
(at the lower left and in the urbanized areas) were assigned values for
"Total U.S." or "Total Mexico" (as appropriate). All values were
multiplied
by 200 to create a larger spread in the data.
4. When one zooms in on the image in 3, eventually the "elevation"
values replace the colored pixels, so that one may check the heights of
each pixel to see that all is correct (see
linked map).
5. Further visual clarification is obtained by removing the backdrop
and zooming in even more, to display the "elevations" to be assigned to
each small location (see
linked map). In the process, all connection with the original
layout
is lost but re-registers when put back.
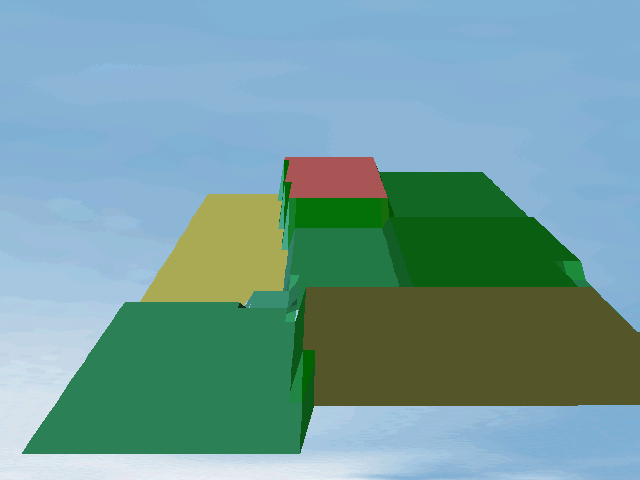
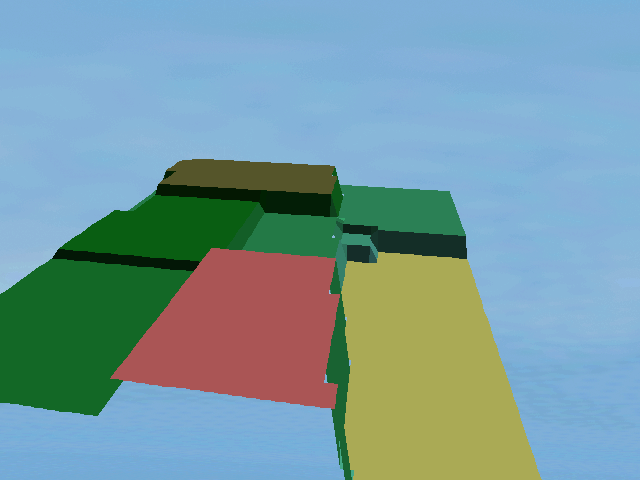
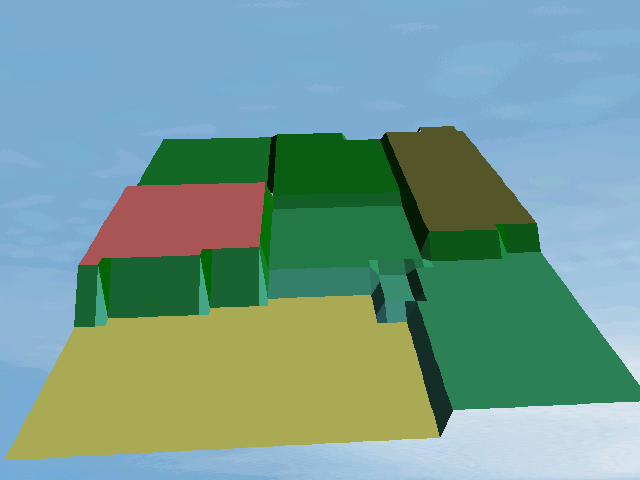
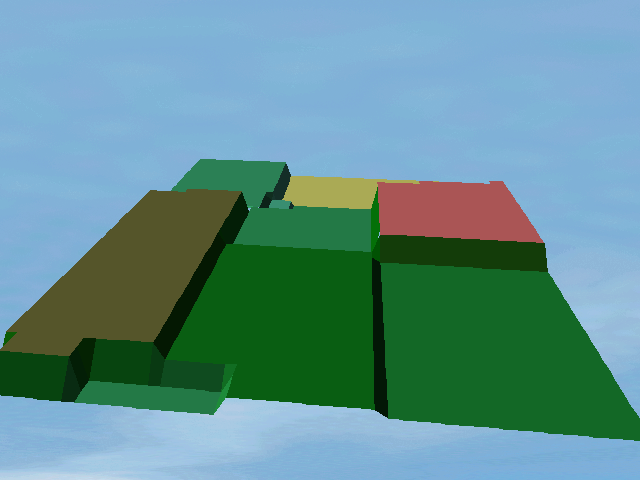
6. With this file of a two-dimensional photo that has been further
loaded with elevations, it becomes possible to load this "digitized"
file
into Visual Animator where the 3-D view of the map comes to life.
All of camera position, target position, vertical exaggeration,
perspective,
camera height, and camera angle have been held at the same setting for
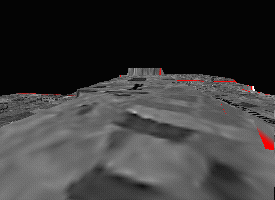
this sequence of four views. The international border runs along the
cliff.
The Mexican border regions show the highest degree of entropy. The U.S.
regions exhibit the lowest values.
8. A flight
through the view above (in 7) appears in the animation below. The
flight begins with a view along the western border. The "plane"
then
moves over to the U.S. Western region and flies eastward, across the
red
boundary separating U.S. West from U.S. East. The border looms
over
the U.S. regions, as cliffs over a channel. The gap through is at
Calexico.
(New York: Simon and Schuster, 1997, 432 pages)
Given the dimensions of the earth in comparison with the size of life forms that are spread over its surface, the collective biosphere is no more than a thin film on the earth’s surface, like an oil slick on a puddle, colorful and fascinating but essentially two dimensional and fragmented. The biosphere is thickest near the seashore with lowland forests and swamplands landward and fishing banks and coral reefs seaward. Until recently it was generally thought that most life in the deep sea occurred in the photic zone, which is the upper most 100 meters or so where light still penetrates. Below in the abyssal deep were thought dwelled only a few strange bottom creatures who survived in total darkness and crushing pressure on the debris raining down from the more abundant life above.
William Broad reports on a different, recently evolving spatial model of life’s domains, in which the biosphere extends throughout the volume of the oceans down to the bottom of the deepest trenches. This three dimensional space greatly exceeds the volume occupied by all living things on land and at the ocean surface. And contrary to previous beliefs, this domain is proving richer and more varied of life forms than even Jules Verne imagined. Small, systematic samples are revealing numerous new species with great variation from place to place. The number of species of life in the deep is now thought likely to exceed the number of all land creatures and plant species at the earth’s surface, although this fact remains uncertain because of our sparse knowledge of deep sea life. Some of the newly discovered deep sea species exist in food chains that are independent of the sun’s energy. They live entirely on heat and minerals brought up from the depth of the earth through undersea volcanic fissures. The huge, dark, and largely unknown three-dimensional space of the oceans is the universe below.
In his book, Mr. Broad reports on the human efforts to probe this world beneath. The exploration began tentatively in the Nineteenth Century and has only been vigorously pursued in the second half of the Twentieth Century. The pace of the exploration quickened in the last decade of the century with access to new and powerful technologies. Mr. Broad divides his chronicle into seven chapters each devoted to one facet of the efforts to enter and explore the deep oceans. He begins with a history of early attempts to penetrate the depths. The huge weight of sea water is the problem. Ten cubic feet of sea water equals roughly one cubic foot of lead. The Titanic rests 2 1/2 miles deep, which is about the average depth of the oceans, and where the water pressure is equal to the weight of a tower of lead the height of the Empire State Building. Life forms of the deep, being made primarily of water that is nearly incompressible, are indifferent to the pressure. Anything hollow or containing a cavity, including humans and many of our devices, are disastrously affected by the pressure, hence, the difficulty in exploring the depths.
In one of the continuing ironies of our age, the military pioneered the technology that opened the oceans to exploration. They made the deep sea a battlefield in the Cold War. The military were not interested in exploration. Their interest was in being able to operate in deep water to support submarine warfare and undersea espionage. The United States developed a technological advantage over the Soviet Union by investing huge resources toward these purposes. Mr. Broad describes several defining events that shaped this effort. For example, in April, 1963, the USS Thresher, the most advanced attack submarine of its day, inexplicably sank, its 129 men lost in water more than a mile and a half deep. The Navy had no way to reach the ship to salvage sensitive equipment or to investigate the mystery of why she was lost. The tragedy led to much greater expenditure on the development of deep submersible craft ostensibly to make possible deep sea rescue operations but also to expand the possibilities for undersea espionage through use of search and salvage capacities to be used to obtain intelligence from sunken Soviet ships, especially nuclear equipment and devices from submarines lost at sea.
Mr. Broad is a Pulitzer prize winning science writer for the New York Times. His investigative powers are evident in this book as he details the political and policy debate that took place in Washington to direct resources into the Navy’s deep submersible operations. Most of the effort was to support espionage which was in line with the tendency of the United States to depend upon technological means for conducting espionage instead of relying on spies and secret agents. After the end of the Cold War much of this military technology was declassified and is now being used in civilian efforts at exploration. Russian equipment is also available for hire and lease as the Soviet Union had also developed deep submersible capabilities during the Cold War.
The chapter on military efforts sets the stage for the remaining chapters by appraising the reader of the difficulties of undersea operations and how the technology addresses them. The rest of the chapters detail the exploration. Chapter three describes a dive in the Pacific Ocean off the Oregon coast in which the author was a passenger of the Alvin, a Navy deep submersible being used by NOAA (National Oceanographic and Atmospheric Administration) to explore undersea volcanic chimneys or smokers around which strange life forms cluster. Chapter four is a report on enterprises that seek to gain fortunes by finding and scavenging lost treasures from shipwrecks buried in deep waters. Deep sea salvaging remains a very expensive activity. Investors want to recover costs by claiming gold and other precious materials or by exploiting public interest in shipwrecks such as with the Titanic. The story reveals that what the technology has now brought within grasp becomes enveloped in controversy over ownership, and moral and ethical issues.
A deep canyon, greater in size than the Grand Canyon, lies beneath Monterey Bay off the central California coast. Because the deep water is very near shore, land-based excursions can frequently be made with much less expense than dives of deep submersibles operating from support ships far out at sea. Chapter Five describes the activities of a research group, whose primary funding comes from David Packard, the billionaire co-founder of the Hewlett-Packard Company. This group, associated with the famous Monterey Bay Aquarium, is using unmanned vehicles to monitor undersea life at all levels to below a mile deep. They are finding an unexpectedly broad range of life forms, which for the first time can be observed in their natural habitat, including many creatures that live at mid-water depths. These life forms have been missed by marine biologist in their rush to the bottom. The Monterey Bay Canyon site is becoming a standard model for deep sea ecology because of the level of exploration but this may be misleading. Other parts of the oceans, though sparsely sampled, reveal different collections of new species that leaves open the questions of total number of species.
Scientist and fortune hunters are not the only groups interested in deep sea exploration. Commercial interests, encouraged by governments throughout the world, are seeking to exploit deep sea resources in large scale commercial ventures. Chapter Six describes these ventures that include deep sea mining and deep sea fishing. Miners are after petroleum and gas under deep sea beds, manganese nodules on the sea floor, and even the minerals dissolved in sea water. Vast amounts of metals and other minerals exist in seawater but no practical way of extracting them exists. The manganese nodules, which contain traces of other metals as well, are thought to have developed through a bio-concentration process which makes the metal aggregations more accessible than in seawater. The modules lie on the seabed in some places like a vast field of cobblestones. Proposed means for mining them call for robotic machinery to sweep over large territories gathering the nodules and discarding debris. The prospects immediately raised concerns by environmentalist who foresaw likely untold damage to a largely unknown ecology.
The Reagan Administration seized upon the possibility of deep sea mining as a way to develop reliable sources of strategic materials independent of foreign nations. This American stance was in opposition to one of the provisions of the Law of the Sea which proposed that all minerals on or below the ocean’s floor belong to all of the people of the world that should be developed by a United Nations enterprise. On the other hand, the United States readily accepted the Exclusive Economic Zone provision that granted to coastal nations ocean resource development rights out to two hundred miles of adjacent oceans. The long American coast lines plus Pacific island possessions and protectorates created a huge American dominion, by far the largest of any nation. Industrial states have staked out large parts of the Pacific Ocean in anticipation of deep sea mining operations. Actual mining has yet to materialize because deep sea operations have to date proved too expensive to undertake.
Deep sea fishing, that is, fishing at great depths is another matter. Several coastal powers have claimed rights to fish resources found at great depth that are within their two hundred mile exclusive zone. For example, New Zealand commercial fishermen found dense schools of orange roughy about one half to one mile deep over a large sea plateau within their exclusive zone. This led to a rapid commercialization in which factory ships equipped with freezers were employed and the product exported to American and European markets. Huge profits were obtained as fish catches from competitors working established fishing banks were in decline. Unfortunately scientists discovered that the orange roughy and other deep fishes could live for more than one hundred years, some of the oldest living creatures on earth. Their slow growth and reproductive cycle makes them highly vulnerable to over exploitation.
One interesting new resource is exclusively a product of the abyssal environment. The huge pressure at great depths keeps water in liquid form even though water emanating from the volcanic smokers is very hot, well above the boiling point of water at one atmosphere. Microbes have been found living in this hot environment in which no terrestrial organism could survive. There is a use for these microbes. Microbiologists use enzymes obtained from bacteria to multiply minute bits of DNA (deoxyribonucleic acid) until sufficient quantities become available for analysis and manipulation. Tiny bits of DNA found at crime scenes can be used to identify individuals involved in an incident. Many other amazing applications of genetic material are being discovered and all use microbes as the factories for multiplying the DNA. The best microbes for this purpose are ones that can withstand high temperatures, a fact first found by work with microbes that live in Yellowstone Park hot springs. The heat-loving microbes from the environment of the deep sea hot smokers yield enzymes that do not break down at high temperatures. New levels of purity and efficiency in producing genetic materials are possible because the chemical reactions involved can be carried out at temperatures that destroy any other bacterial contaminants.
The final chapter contains warning of detrimental human impact on the universe below. In the early years of the atomic age radioactive wastes were routinely dumped in deep waters just off-shore from populated coastlines. Most nations ended this practice but the radioactive level in several hot spots around the world remain very high and are not well contained. Other biologically active pollutants are also reaching the abyssal deep in waste streams from coastal industrial and urban sources. Human induced environmental change through contamination and over exploitation has resulted in irreparable damage to other ecosystems. We would be well advised to take care of next wilderness that we are beginning to enter.
Mr. Broad’s book is and informative and interesting. He provides detailed notes and references throughout the book to document his information sources. He also provides a useful glossary, a chronology of important events in deep ocean exploration, and a bibliography. Beyond presenting a well written and structured book, he engages the reader with a sense of wonder that come from exploration of a domain on earth still unknown in modern times.
