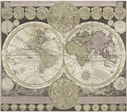
Other Astronomical MapsStar maps are useful: For much of human history they have been relied upon for navigation. As a result, tremendous amounts of time and effort have been poured into the creation of ever more accurate celestial maps, and the results have often been spectacular. But all of these maps are essentially concerned with the same thing: representing the sky as accurately as possible given the constraints imposed by the printed page. We can thus speak legitimately of celestial cartography, a largely mathematical discipline whose goal is to accurately translate the three dimensions of the celestial sphere into two-dimensional space. While the history of celestial cartography is full of disputes over the location and representation of astronomical objects, rarely has a scientific theory been at stake in these maps. Such is not the case when it comes to the diagrams included in this section, which are examples of what Nick Kanas refers to as cosmological maps: These images consisted of diagrams of heavenly bodies or of the entire solar system that reflected both contemporary and ancient cosmological systems. The components of these systems were shown with reference to each other in the sky and in some cases to the background stars.1 Unlike the star charts of the previous section these diagrams are not examples of cartography per se; rather, they are persuasive devices whose function was to educate and convince, and at times lives have depended on their ability to perform these tasks successfully. If they have failed to capture the public's imagination to the extent that star maps have done, they have nevertheless played a direct role in determining how we experience the universe by influencing the course of scientific discovery. Although we will not here attempt to trace the genealogy of cosmological theories through diagrams, the interested viewer will find in this section a history in miniature of universal systems from Ptolemy to Copernicus, Tycho and Descartes. (The Harmonia Macrocosmica of Andreas Cellarius, which is included in the Atlases & Charts section of this exhibit, contains many more cosmological diagrams of this nature.) In addition there are diagrams of cometary orbits, solar and lunar eclipses, the phases of the moon and illustrations of astronomical instruments. Many of these diagrams found their way into geographical atlases and were printed alongside world maps and illustrations of geological phenomena. This makes for an interesting diversity of material, something celestial maps do not always provide. 1 Kanas 1. |


