An electronic journal of geography and mathematics
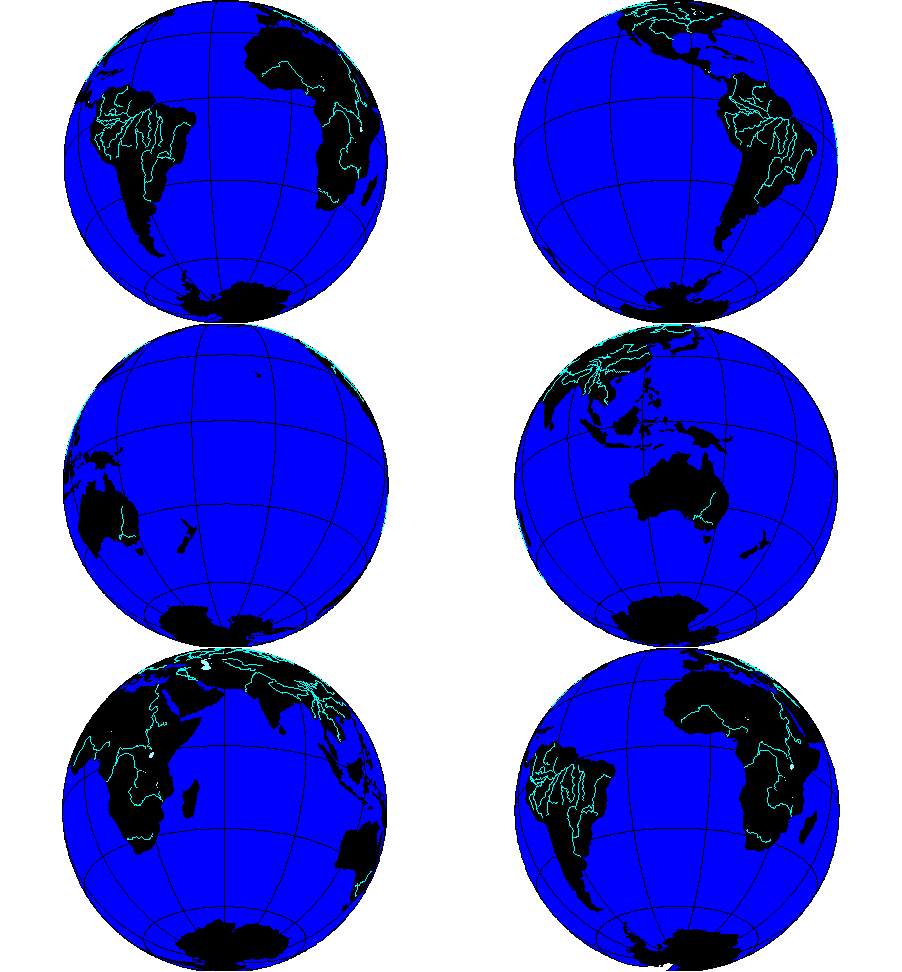
Earth: with 23.5 degrees south latitude as the central parallel.
Volume IX
Number 2
DECEMBER, 1998
Volume IX, Number 2, 1998
Cover
Front matter: Winter, 1998. Editorial
Board, Advice to Authors, Mission Statement.
Sandra Lach Arlinghaus. Animated
Four Color Theorem: Sample Map.
Sandra Lach Arlinghaus. Animaps,
II.
Daniel Albert. Book Review: Rising
Tide: The Great Mississippi Flood of 1927 and How it Changed America,
by
John M. Barry
SOLSTICE:


AN ELECTRONIC JOURNAL OF GEOGRAPHY AND MATHEMATICS


http://www.imagenet.org


WINTER, 1998


VOLUME IX, NUMBER 2


ANN ARBOR, MICHIGAN


Founding Editor-in-Chief:


     Sandra Lach Arlinghaus, University of Michigan;

Institute of Mathematical Geography (independent)


Editorial Advisory Board:


  Geography.

     Michael F. Goodchild, University of California, Santa Barbara

     Daniel A. Griffith, Syracuse University

     Jonathan D. Mayer, University of Washington (also School of Medicine)

     John D. Nystuen, University of Michigan


  Mathematics.

     William C. Arlinghaus, Lawrence Technological University

     Neal Brand, University of North Texas

     Kenneth H. Rosen, A. T. & T. Bell Laboratories


  Engineering Applications.

     William D. Drake, University of Michigan


  Education.

     Frederick L. Goodman, University of Michigan


  Business.

     Robert F. Austin, Austin Communications Education Services.


  Book Review Editors:

     Richard Wallace, University of Michigan.

     Kameshwari Pothukuchi, Wayne State University


  Web Design:

     Sandra L. Arlinghaus

     William E. Arlinghaus.


WebSite:  http://www.imagenet.org


Electronic address:  sarhaus@umich.edu


MISSION STATEMENT


     The purpose of Solstice is to promote interaction between geography

and mathematics. Articles in which elements of one discipline are used to

shed light on the other are particularly sought.  Also welcome are

original contributions that are purely geographical or purely

mathematical.  These may be prefaced (by editor or author) with commentary

suggesting directions that might lead toward the desired interactions.

Individuals wishing to submit articles or other material should contact an

editor, or send e-mail directly to sarhaus@umich.edu.


SOLSTICE ARCHIVES


     Back issues of Solstice are available on the WebSite of the Institute

of Mathematical Geography, http://www.imagenet.org and at various sites

that can be found by searching under "Solstice" on the World Wide Web.

Thanks to Bruce Long (Arizona State University, Department of Mathematics)

for taking an early initiative in archiving Solstice using GOPHER.


PUBLICATION INFORMATION


     The electronic files are issued yearly as copyrighted hardcopy in the

Monograph Series of the Institute of Mathematical Geography.  This

material will appear in Volume 22 in that series, ISBN to be announced.

To order hardcopy, and to obtain current price lists, write to the


Editor-in-Chief of Solstice at 2790 Briarcliff, Ann Arbor, MI 48105, or

call 313-761-1231.
Send books for review also to the above address.
     Suggested form for citation:  cite the hardcopy.  To cite the

electronic copy, note the exact time of transmission from Ann Arbor, and

cite all the transmission matter as facts of publication.  Any copy that

does not superimpose precisely upon the original as transmitted from Ann

Arbor should be presumed to be an altered, bogus copy of Solstice.  The

oriental rug, with errors, serves as the model for creating this weaving

of words and graphics.
ANIMATED FOUR COLOR THEOREM: SAMPLE MAP
Sandra Lach Arlinghaus
The Four Color Problem has a rich history. Readers interested in the history might wish to read appropriate selections in The World of Mathematics. Here, it is simply stated as a theorem and then animated on a U.S. states map.
The Four Color Theorem.
In the plane, four colors are sufficient to color any map and necessary to color some.
Note: adjacent regions are to be colored different colors. States that touch at a point only are not considered to be adjacent.
In the coloring scheme below, red was generally used as first choice, green as second, yellow as third, and purple as fourth. The second, third, and fourth choices were used only when required.
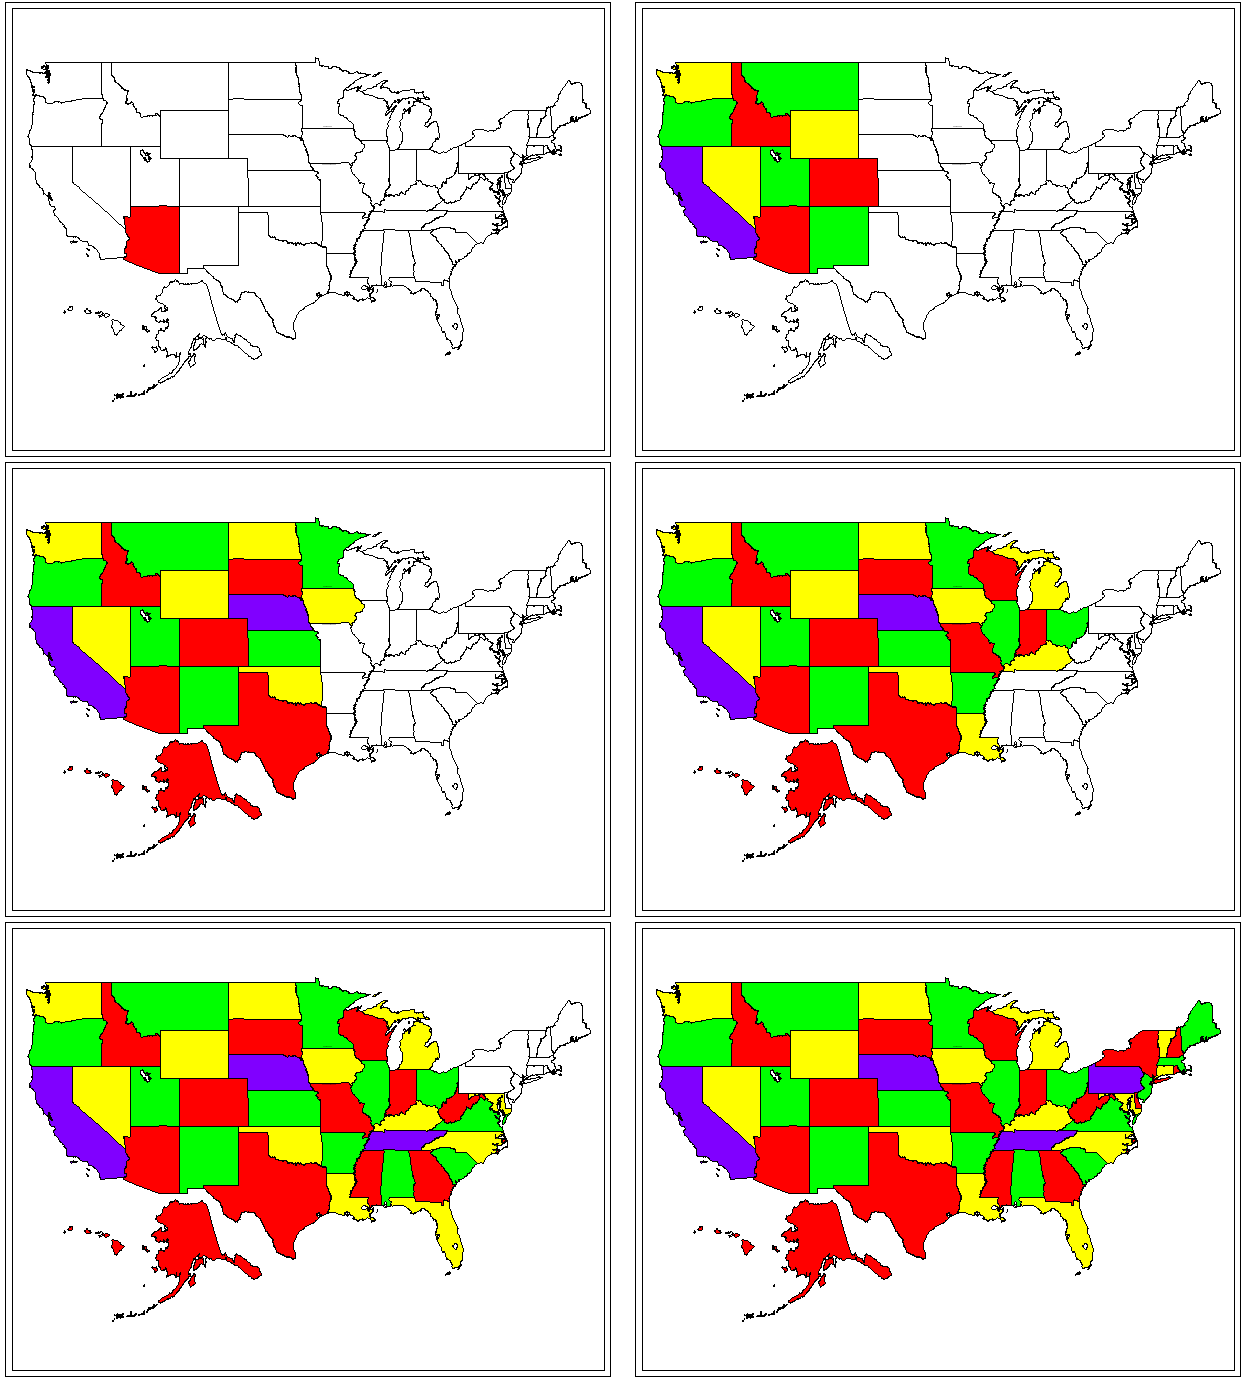
On occasion, the general strategy was violated in order to color
efficiently;
for example, Montana was colored green so that Idaho could be colored
red
in a vertical alternation pattern of red/green/red. The coloring
is not unique. Indeed, one can make inefficient choices so that
it
appears that one "needs" a fifth color. The ambitious reader
might
try to improve upon the scheme here. However, there is always a four
(or
fewer) color solution available although it may not be easy to
find.
Surprisingly, the solution to coloring requirements on surfaces other
the
plane were determined well ahead of the solution in the plane.
Thus, it seems suitable that desktop GIS
packages
should default to four color categories when making thematic
maps.
Some software does and some does not.
References
Appel, K. and Haken, W. A proof of the 4-color theorem. Discrete Mathematics, 16, 1976, no. 2 (and related references found therein).
Newman, James R., Ed. The World of Mathematics (in
four
volumes). New York: Random House, 1956. See
especially
the chapter entitled "Topology" by R. Courant and H. Robbins.
ANIMAPS, II
Sandra Lach Arlinghaus
Animated maps, "animaps," offer a unique opportunity to visualize changes in spatial pattern over time. Diffusion studies thus offer a natural platform from which to launch animaps (for samples, see "Animaps" in previous issue of Solstice). These maps are dwellers of cyberspace, dependent on it for their existence. To "publish" such a map in a conventional medium, such as a book, would require pages of maps (a costly venture) and still the animation, or time-tracking feature, would be lost (unless of course, as seems to becoming more and more the practice, a CD or similar medium with book files is included with the hard-copy book). Previous work has illustrated the utility of animated maps in a number of diffusion contexts. In this article, animated maps are used as tools to refresh, enliven, and analyze historical maps as well as conceptual models; hopefully, this approach will serve to underscore, as a side issue, the importance of converting historical files and other enduring ideas to an electronic format. These animated maps are presented in the common Euclidean dimensions of point, line, and area. Left to the future is to examine them more generally in Euclidean space as well as in classical non-Euclidean space and then to permit fractional dimension.
An Historical Context: the Berlin Rohrpost
Beginning in 1853, a number of experiments with
relatively expensive underground pneumatic communications systems were
underway in western Europe. After slowdowns caused by the Seven Weeks
War
(1866) and the Franco-Prussian War (1870), full-fledged pneumatic
communications
systems began to appear in major cities in western Europe as a speedy
alternative
to mail delivery through congested surface streets. Among others,
the city of Berlin boasted a substantial pneumatic postal network,
known
(appropriately) as the "Rohrpost."
By 1901, the "Rohrpost" carried messages under most
of Berlin (Figure 1). The heart of the message system was in a central
office on Unter den Linden, denoted as the largest circle in Figure 1.
Adjacent graphical nodes were linked as underground real-world nodes by
"edges" of metal tubing. The real-world nodes had surface housing that
could pump and compress air and thus receive and deliver messages.
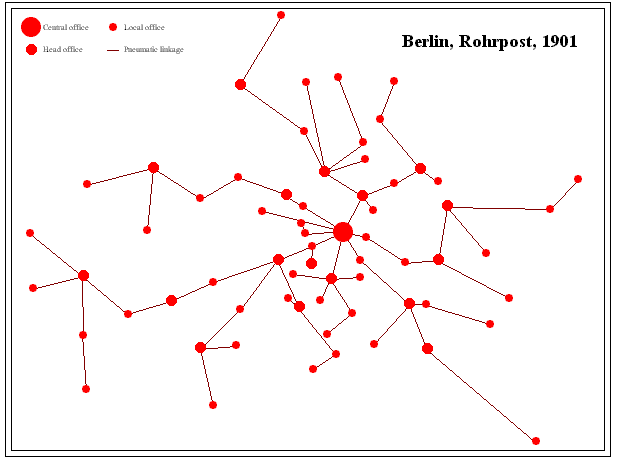
Figure 1. Static map showing a hierarchy of nodes in the
Rohrpost
network.
The map of the Rohrpost (Figure 1) shows the linkage pattern of edges joining nodes and reflects, only indirectly as a static map, a hierarchy in the procedure for message transmission. Certain pneumatic stations were designated as having functions of a higher level of service than were other locations. Typically, message containers were pushed, using compressed air, from one higher order office to a handover position intermediate between higher order offices. From this handover position, suction drew the carrier toward the next higher order office. The animated map (Figure 2) shows clearly one handover node, belonging to both black and blue subnetworks. This node is a transfer point, or gate, from compression to suction, as are all other similar offices. This kind of partition was useful in suggesting a graphic code that could be used to track the progress of a message through the system (and thus detect the location of collisions or blockages).

Figure 2. Animated map showing handover position between adjacent subnetworks: this position is a transfer point from compression to suction within the system.
One might wish to consider more than the
actual
pattern of transmission. Would an analysis of this Rohrpost map,
based on existing technique, have yielded an answer that coincided with
actual field circumstances as to which node is the hub of the
network?
Thus, consider the map as a scatter of nodes linked by edges.
The concept of center measures, to some extent,
how tight the pattern of connection is around a core of nodes. It
measures
whether or not there is central symmetry within the structural model:
whether or not accessibility within the network is stretched
in one direction or another. This sort of broad, intuitive, notion
of center does not take into account the idea of volume of traffic; to
do so requires looking at more than direct adjacencies in calculating
weights
for nodes. What happens in a remote part of town may influence traffic
patterns across town. The concept of centroid, which rests on the idea
of branch weight--the number of edges in the heaviest branch attached
to
each node, does so. The animated map in Figure 3 shows the branch
weight
for each node in the Rohrpost. The red node has a heaviest branch
with 19 edges in it (shown as the black subnetwork in the
animation).
Other nodes are color coded according to heaviest branches. Those
nodes with higher values are more peripheral in their function to the
network:
a node with a branch weight of 65 has one route coming from it with 65
edges in it--crossing the entire network from one side to the other.
Nodes
in a peripheral position have longer heaviest branches and therefore
greater
branch weights than do nodes in the interior. Thus, it is reasonable
numerically
to view the most central, in this context, as the node(s) with the
smallest
branch weight. In this case, the centroid is the red node and it does
coincide
with the actual network hub.
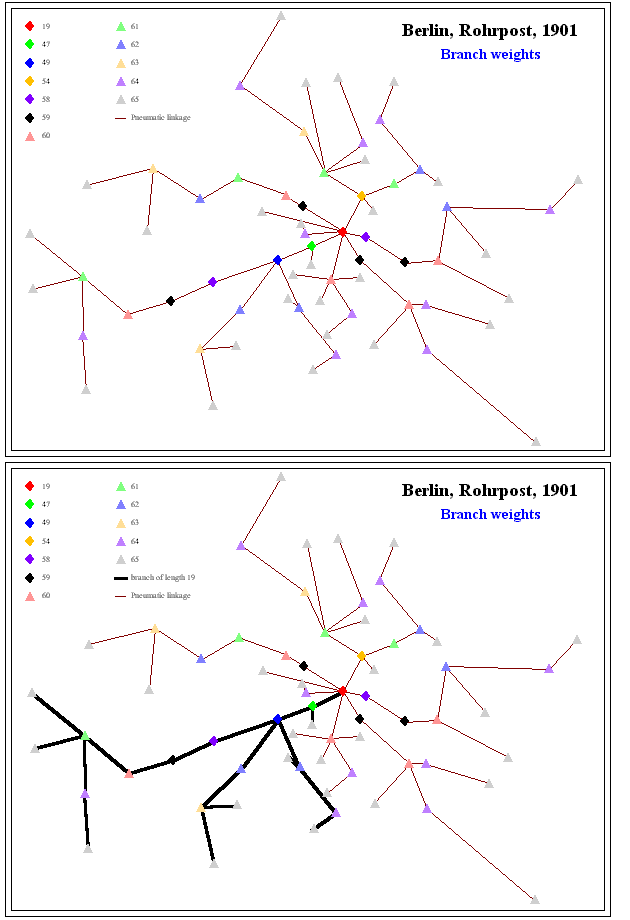
Figure 3. Example to illustrate branch weight. The heaviest branch
from the red node in the Rohrpost has 19 edges, labeled in this figure.
All nodes in the Rohrpost graph are labeled with branch weights. Those
of lowest value (in this case one node) serve as the centroid.
Beyond the mere calculation of the centroid of the network, one might wonder about using the measure to capture other elements of the network. Thus, the animated map in Figure 4 shows all nodes colored according to branch weight. The first frame of the animation shows the single node of weight 19 as a red node. The next frame shows the node of weight 47 as a red node and shows the node from the previous frame as a black node. Iteration of this coloring strategy, using red for nodes added in a frame and black for nodes accumulated through previous frames, produces the pattern shown in Figure 4. In addition, the time-spacing between successive frames is tied to the numerical distance between branch weights; thus, the time-distance between frames 1 and 2 of the animation (from branch weight 19 to branch weight 47) is substantially longer than is the time distance between any two other successive frames in the animation.
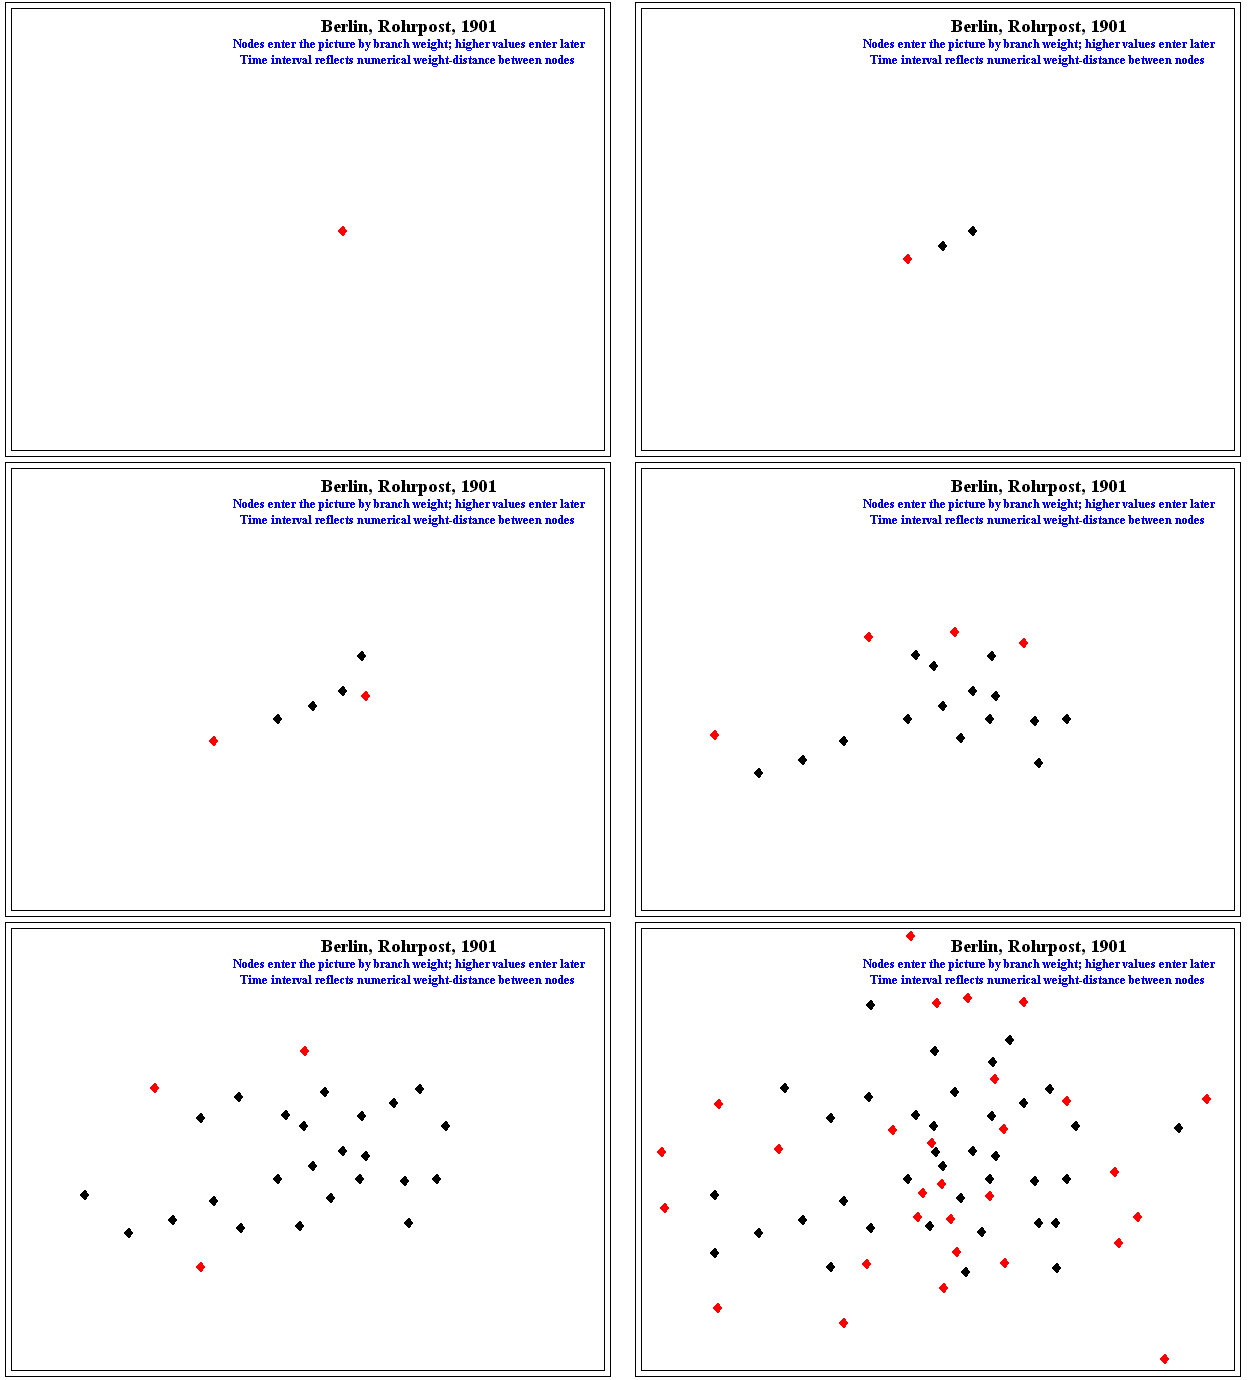
Figure 4. Note in this case the long wait in the animation from the central office to the next tier of offices suggesting the highly dominant central role (in terms of structure) played by the "central" office. Next most dominant is the role of the line of core of offices under Unter den Linden.
What the animation shows is the dominance of the central node and a line of tight control emanating from the center with many peripheral nodes, of roughly equivalent lack of centrality, scattered throughout. When the animation is checked back against the original, this "line" is in fact composed of pneumatic postal offices under Unter den Linden, a central thoroughfare in Berlin during this time period. The fit between model and field is precise at both the point (centroid) and line (street) levels. Thus, one might speculate that the areal pattern of extension/sprawl and infill evident in the Rohrpost animation of Figure 4 functions as a surrogate for actual neighborhood population density patterns in Berlin in 1900 and is thus of significance in studying planning efforts of the time. When this sort of idea is extrapolated to the future, it is not difficult to imagine, instead, satellite positions serving as a similar backdrop against which to test models that can then be extended to offer extra insight about terrain or human conditions.
A Conceptual Model Context: Hagerstrand's Diffusion of an
Innovation
The context above suggests one way for considering
patterns of spatial extension/sprawl and infill using tools from the
mathematics
of graph theory. Another, based on probabilistic considerations,
employs numerical simulation to speculate or plan. To follow the
mechanics
of Torsten Hagerstrand's simulation of the diffusion of an innovation,
it is necessary only to understand the concepts of ordering the
non-negative
integers and of partitioning these numbers into disjoint sets. Indeed,
the theoretical material from mathematics of "set" and "function" will
underlie the real-world issues of "form" and "process."
Some of Hagerstrand's Basic Assumptions of the Simulation Method (Monte Carlo)
Assumptions to create an unbiased gaming table:
- the surface is uniform in terms of population and transport
- all contacts are equally easy in any direction
- there are an equal number of potential acceptors in each cell
- There is a set of carriers at the start (as in Figure 1)
- information is transmitted at constant intervals
- when carrier meets a new person, acceptance is immediate
- the likelihood of a carrier and another meeting depends on the distance between them (distance-decay).
Figure 5 shows a map of an hypothetical region of the world. After one year, a number of individuals accept a particular innovation. Figure 6 shows a color-coded version of Figure 5; darker colors represent cells with a higher number of initial acceptors.
MAP BASED ON EMPIRICAL EVIDENCE--REGION INTERIOR IS SHADED WHITE;
CELLS
WITH NUMERALS IN THEM INDICATE NUMBER OF ACCEPTORS IN LOCAL REGION.
| aa | a | A | B | C | D | E | F | G | H | I | J | K | L | M | N |
|
|
a | a | a | a | a | a | a | a | a | a | a | a | a | a | a |
|
1
|
a | a | a | a | a | a | a | a | |||||||
|
2
|
a | a |
1
|
1
|
a | a | |||||||||
|
3
|
a |
1
|
a | ||||||||||||
|
4
|
a |
5
|
1
|
a | |||||||||||
|
5
|
a | a |
2
|
a | |||||||||||
|
6
|
a |
2
|
|||||||||||||
|
7
|
a |
1
|
3
|
a | |||||||||||
|
8
|
a |
1
|
1
|
1
|
a | ||||||||||
|
9
|
a | a |
1
|
a | |||||||||||
|
10
|
a | a |
1
|
a | a | a | a | a | a | a | a | ||||
|
11
|
a | a | a | a | a | a | a | a | a | a | |||||
|
12
|
a | a | a | a | a | a | a | a | a | a |
Figure 5. Distribution of original acceptors of an innovation--after 1 year--based on empirical evidence. After Hagerstrand, p. 380.
MAP BASED ON EMPIRICAL EVIDENCE--REGION INTERIOR IS SHADED WHITE;
LIGHTEST
COLOR REPRESENTS FEWEST ACCEPTORS. DARKER COLORS REPRESENT MORE
ACCEPTORS
| aa | a | A | B | C | D | E | F | G | H | I | J | K | L | M | N |
|
|
a | a | a | a | a | a | a | a | a | a | a | a | a | a | a |
|
1
|
a | a | a | a | a | a | a | a | |||||||
|
2
|
a | a |
a
|
a
|
a | a | |||||||||
|
3
|
a |
1
|
a | ||||||||||||
|
4
|
a |
5
|
1
|
a | |||||||||||
|
5
|
a | a |
2
|
a | |||||||||||
|
6
|
a |
2
|
|||||||||||||
|
7
|
a |
1
|
3
|
a | |||||||||||
|
8
|
a |
1
|
1
|
1
|
a | ||||||||||
|
9
|
a | a |
1
|
a | |||||||||||
|
10
|
a | a |
1
|
a | a | a | a | a | a | a | a | ||||
|
11
|
a | a | a | a | a | a | a | a | a | a | |||||
|
12
|
a | a | a | a | a | a | a | a | a | a |
Figure 6. A color-coded version of Figure 5.
In Figure 7, a map of the same region shows the pattern of acceptors
after two years--again, based on actual evidence. Notice that the
pattern
at a later time shows both spatial expansion and infill. These two
latter
concepts are enduring ones that appear over and over again in spatial
analysis
as well as in planning at municipal and other levels. Figure 8 shows a
color-coded version of Figure 7.
| aa | a | A | B | C | D | E | F | G | H | I | J | K | L | M | N |
|
a
|
a | a | a | a | a | a | a | a | a | a | a | a | a | a | a |
|
1
|
a | a | a | a | a | a | a | a | |||||||
|
2
|
1
|
1
|
a | a | |||||||||||
|
3
|
a |
1
|
1
|
1
|
a | ||||||||||
|
4
|
a |
6
|
1
|
1
|
1
|
a | |||||||||
|
5
|
a | a |
2
|
1
|
a | ||||||||||
|
6
|
a |
5
|
|||||||||||||
|
7
|
a |
1
|
1
|
1
|
3
|
a | |||||||||
|
8
|
a |
1
|
1
|
2
|
2
|
a | |||||||||
|
9
|
a | a |
1
|
1
|
a | ||||||||||
|
10
|
a | a |
1
|
a | a | a | a | a | a | a | a | ||||
|
11
|
a | a | a | a | a | a | a | a | a | a | |||||
|
12
|
a | a | a | a | a | a | a | a | aa | a |
Figure 7. Actual distribution of acceptors after two years.
| aa | a | A | B | C | D | E | F | G | H | I | J | K | L | M | N |
|
a
|
a | a | a | a | a | a | a | a | a | a | a | a | a | a | a |
|
1
|
a | a | a | a | a | a | a | a | |||||||
|
2
|
1
|
1
|
a | a | |||||||||||
|
3
|
a |
1
|
1
|
1
|
a | ||||||||||
|
4
|
a |
6
|
1
|
1
|
1
|
a | |||||||||
|
5
|
a | a |
2
|
1
|
a | ||||||||||
|
6
|
a |
5
|
|||||||||||||
|
7
|
a |
1
|
1
|
1
|
3
|
a | |||||||||
|
8
|
a |
1
|
1
|
2
|
2
|
a | |||||||||
|
9
|
a | a |
1
|
1
|
a | ||||||||||
|
10
|
a | a |
1
|
a | a | a | a | a | a | a | a | ||||
|
11
|
a | a | a | a | a | a | a | a | a | a | |||||
|
12
|
a | a | a | a | a | a | a | a | aa | a |
Figure 8. A color-coded version of Figure 7.
Might it have been possible to make an educated guess, from Figure 5
alone, as to how the news of the innovation would spread? Could Figure
7 have been generated/predicted from Figure 5? The steps below will use
the grid in Figure 9 to assign random numbers to the grid in Figure 5,
producing Figure 10 as a simulated distribution of acceptors after two
years.
- Construct a "floating" grid (Figure 9) to be placed over the grid on the map of Figure 5, with grid cells scaled suitably so that they match. Center the floating grid on a square in Figure 5 in which there exists an adopter (say 2F)...this is the first cell, working left to right and top to bottom, which contains a numeral. The numbers in the floating grid, used with a set of four digit random numbers, will be used to determine likely location of new adopters. It is assumed that the adopter in F2 (or in any other cell) is more likely to communicate with someone nearby than with someone far away; velocity of diffusion is expressed in terms of probability of contact.
- This assumption regarding distance and probability of contact is reflected in the assignment of numerals within the grid--there are the most four digit numbers in the central cell, and the fewest in the corners. The floating grid partitions the set of four digit numbers {0000, 0001, 0002, ..., 9998, 9999} into 25 mutually disjoint subsets.
|
|
|
|
|
|
|
|
|
|
|
|
|
|
|
|
|
|
|
|
|
|
|
|
|
|
|
|
|
|
- Given a set (or sets) of four digit random numbers--as below. Center the floating grid on F2. Use the first set of random numbers below. The first number is 6248 and it lies in the center square of the overlay. So in the simulation, the previous Figure 5 acceptor in F2 finds another acceptor nearby in F2. Use the map in Figure 10 to record the simulated distribution (a red entry). In cell F2, enter a red +1 to represent the initial adopter. Together with the original adopter, there are now two adopters in this cell.
| RANDOM NUMBERS | a | |
| a | a | a |
| SET 1 | SET 2 | SET 3 |
| a | a | a |
| 6248 | 4528 | 8175 |
| 0925 | 3492 | 7953 |
| 4997 | 3616 | 2222 |
| 9024 | 3760 | 2419 |
| 7754 | 4673 | 5117 |
| a | a | a |
| 7617 | 3397 | 1318 |
| 2854 | 8165 | 1648 |
| 2077 | 7015 | 3423 |
| 9262 | 8874 | 2156 |
| 2841 | 8443 | 1975 |
| a | a | a |
| 9904 | 7033 | 3710 |
| 9647 | 0970 | 4932 |
| 3432 | 2967 | 1450 |
| 3627 | 0091 | 4140 |
| 3467 | 6545 | 5256 |
| a | a | a |
| 3197 | 7880 | 4768 |
| 6620 | 5133 | 9394 |
| 0149 | 1828 | 5483 |
| 4436 | 5544 | 8820 |
| 0389 | 6713 | 7908 |
| a | a | a |
| 0703 | 5920 | 2416 |
| 2105 | 5745 | 9414 |
| a | a | A | B | C | D | E | F | G | H | I | J | K | L | M | N |
|
|
a | a | a | a | a | a | a | a | a | a | a | a | a | a | a |
|
1
|
a | a | a | a | a | 1 | a | a | a | ||||||
|
2
|
a | a |
1+1
|
1
|
a | a | |||||||||
|
3
|
a |
1+1
|
a | ||||||||||||
|
4
|
a | 1 |
5+1
|
1+1 |
1
|
a | |||||||||
|
5
|
a | a |
2+1
|
1 | 1 | ||||||||||
|
6
|
a | 1 |
2+1
|
1 | |||||||||||
|
7
|
a |
1+1
|
3+1+3
|
a | |||||||||||
|
8
|
a |
1+1
|
1+1+1
|
1
|
a | ||||||||||
|
9
|
a | a |
1
|
a | |||||||||||
|
10
|
a | 1 |
1
|
a | a | a | a | a | a | a | a | ||||
|
11
|
a | a | a | a | a | a | a | a | a | a | |||||
|
12
|
a | a | a | a | a | a | a | a | a | a |
| aa | a | A | B | C | D | E | F | G | H | I | J | K | L | M | N |
|
|
a | a | a | a | a | a | a | a | a | a | a | a | a | a | a |
|
1
|
a | a | a | a | a | 1 | a | a | a | ||||||
|
2
|
a | a |
2
|
1
|
a | a | |||||||||
|
3
|
a |
2
|
a | ||||||||||||
|
4
|
a | 1 |
6
|
2 |
1
|
a | |||||||||
|
5
|
a | a |
3
|
1 | 1 | ||||||||||
|
6
|
a | 1 |
3
|
1 | |||||||||||
|
7
|
a |
2
|
7
|
a | |||||||||||
|
8
|
a |
2
|
3
|
1
|
a | ||||||||||
|
9
|
a | a |
1
|
a | |||||||||||
|
10
|
a | 1 |
1
|
a | a | a | a | a | a | a | a | ||||
|
11
|
a | a | a | a | a | a | a | a | a | a | |||||
|
12
|
a | a | a | a | a | a | a | a | a | a |
Figure 11. A color-coded version of Figure 10.
- Pick up the floating grid and center it on G2. The second random number is 0925, located in the first cell northwest of the center cell of the overlay, cell F1. In Figure 10, a 1 in cell G2 to represent the original adopter, and a 1 in cell F1 represents the later (new) adopter.
- Continue this process, shifting the overlay so that it is centered on every cell with at least one early adopter (from Figure 5). Work from left to right, top to bottom. Use a different random number for each early adopter. If there are 3 early adopters in a given cell, use three different random numbers in entering the results in Figure 10. Just use the random numbers (supposedly already randomized) reading down the column. The enthusiast might wish also to animate the entire movement pattern of the grid.
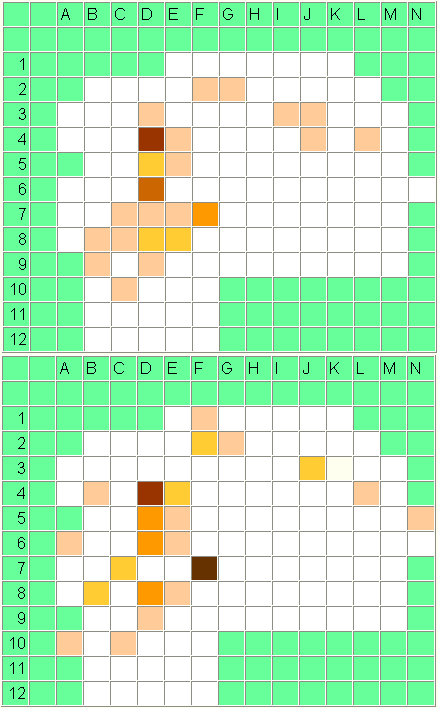
Figure 12. Two-frame animation. First frame contains actual distribution of adopters after two years. Second frame contains simulated distribution of adopters after two years.
How does the color-coded simulation (Figure 11) compare to the actual distribution of adopters after two years (Figure 8)? Consider the animated map that superimposes actual and simulated distributions as one way to compare pattern (Figure 12). The reader might enjoy using the second and third columns of random numbers to create more simulations and compare them to the first simulation and the actual distribution. From a visual standpoint, one might further imagine subtracting cells from one another and then animating the results. From the standpoint of municipal planning and policy considerations, one might imagine applying this sort of animated model to target key initiators (within a subdivision parcel map, for example) of innovative urban or environmental character that relies on word-of-mouth diffusion throughout a neighborhood. Using a simulation strategy based on location of known neighborhood trend-setters can maximize diffusion of a favored practice while minimizing expenditure of scarce tax-payer funds. Models that can be simply executed have fine potential for actually being used in real-world settings.
References
Arlinghaus, Sandra L. 1985. Down
the Mail Tubes: The Pressured Postal Era, 1853-1984. Ann Arbor:
Institute
of
Mathematical Geography, Monograph #2, 80 pages.
Arlinghaus, Sandra L., Drake, William D., Nystuen, John D., with input from Laug, Audra, Oswalt, Kris; and, Sammataro, Diana, 1998. Animaps. Solstice: An Electronic Journal of Geography and Mathematics, Summer, 1998.
Hagerstrand, Torsten. Innovation Diffusion as a Spatial Process.
Translated by Allan Pred.
University of Chicago Press, 1967.
Beschreibung der Rohrpost. 1901. Berlin.
U.S. Postmaster General, 1891. Annual Report. Washington, D.C.: U.S.
Post Office Department.
by John M. Barry.
(New York: Simon & Schuster, 1997).
There are really two stories here, one of the men who had tried to control the river since the early nineteenth century, and one of the men who responded when disaster struck the Mississippi Delta. The characters of the first story are the engineers who debated the "levees only" policy of flood control. Following the theories of the seventeenth-century Italian engineer Giovanni Domenico Guglielmini, some engineers believed that a system of levees would control flood waters not only by damming the banks but also by increasing the velocity of the river's flow and hence its tendency to scour its own bottom. In effect, the levees-only theory held that the river in flood could be made to dig its own channel. Barry describes bitter rivalries among engineers; some advocating a strict levees-only policy, while others call for creating a system of outlets to divert flood waters. In particular, the author describes a struggle among James Buchanan Eads, famed builder of bridges and Civil War gunboats, Andrew Atkinson Humphreys, the quintessential Army Corps engineer, and Charles Ellet, Jr., a brilliant civilian engineer, to dominate flood control policy. While Eads pursued a system of jetties to increase the speed of the current even at low water, Humphreys and Ellet competed to produce definitive recommendations on river policy.
Mathematically-inclined readers may find much to enjoy here as the author explains how a river flows -- and floods. We learn about declivity, sediment carrying capacity, and dynamic measures such as "second-feet," which describes both the volume and force of a flood. Barry does not share the hubris of nineteenth-century engineers who thought that they could know and therefore control the river. Although engineers could understand the Po, the Rhine, the Missouri, and even the upper Mississippi, the turbulent vicissitude of the Mississippi Delta remains unknowable.
The second story is that of the flood itself, the final futile efforts to contain it, and the relief effort that followed in its wake. The flood, in Barry's telling, undercut the power of local leaders, spurred black migration to the industrial north, and helped position Herbert Hoover to win the presidency. With their homes flooded, thousands moved into refugee camps on the only dry ground left -- the levees themselves. Things were not easy for anyone, but they were especially difficult for African Americans who were held in refugee camps at gunpoint. In one instance, armed Boy Scouts were deployed to guard a segregated black camp.
Yet here too the focus is on great men (indeed, women are all but nonexistent). There is LeRoy Percy, the most powerful man in Greenville, Mississippi, and symbol of the Old South. There is Herbert Hoover, "The Great Humanitarian," who is shown here to be far more politically astute and ruthless than that moniker would suggest. And there is the African-American leader Robert Russa Moton, successor to Booker T. Washington at the Tuskegee Institute and chairman of the commission that investigated reports of brutality against flood victims. When the floods came, Percy warned that poor treatment of blacks in the refugee camps would only encourage out-migration to the industrial north. Barry argues convincingly that Percy was right and that this was a more important factor in the black migration than increased mechanization of farming, the more standard explanation.
Barry provides such rich and complete detail on his characters that they come to life on the page. But this focus sometimes leads him astray. For example, the choice of a levees-only policy emerges not from the bitter wrangling of the engineers, but from a bias in federal policy toward internal improvements for interstate commerce. As Barry himself notes, since levees promised to deepen the river channel, while outlets would only make it harder to navigate, federal money was available for the former and not the latter. That levees-only had become the dogma of the U.S. Army Corps of Engineers by the 1920s says more about the personality of that institution than that of its leaders.
Many geographers will no doubt find this work a fascinating account; some, however, might be disappointed that Barry's reverence for the river and the attempt to control its flooding obscures the great waterway's economic function. He makes mention of the competition between railroad and river traffic, but only indirectly in the context of a Reconstruction-era railroad bridge built at St. Louis. Bridges over rivers are often physical manifestations of power relationships between those who travel and ship by land and those who do the same by water. Barry makes mention of this political dynamic, but the building of the bridge at St. Louis is portrayed as evidence of one man's iron will rather than as the upshot of transportation politics. More important, the Great Lakes and New York State Barge Canals are absent from his story. Traffic on the Great Lakes outstripped Mississippi River traffic by the middle of the nineteenth century, and efforts to control the river have been as much about making the river a safe and efficient highway as they have been about flood control. Notably absent from the extensive bibliography in this regard are Louis C. Hunter's classic Steamboats on Western Rivers and William Cronon's more recent Nature's Metropolis, which discusses the rivalry between Chicago railroads and St. Louis steam boats in some detail.
--Daniel Albert, University of Michigan