Search Constraints
« Previous |
241 - 260 of 415
|
Next »
Search Results
Select an image to start the slideshow

Results for "New Findings from Explainable SYM-H Forecasting using Gradient Boosting Machines"
1 of 20
MiGHT Calibration Survey Dataset
2 of 20
Data for Analysis of features in a sliding threshold of observation for numeric evaluation (STONE) curve
3 of 20
Turbulent jet large eddy simulation
4 of 20

Apatite and Zircon (U-Th)/He Thermochronometry Data from the Colorado Front Range, Boulder County, Colorado, USA
5 of 20

Aircraft Data (2021) for Flaring & Fossil Fuels: Uncovering Emissions & Losses (F3UEL)
6 of 20
Aircraft Data (2020) for Flaring & Fossil Fuels: Uncovering Emissions & Losses (F3UEL)
7 of 20
Skelevision Dataset
8 of 20

CT Data of UMMP VP 115547, Sifrhippus grangeri L1 vertebra
9 of 20
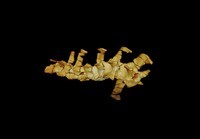
CT Data of UMMP VP 115547, Sifrhippus grangeri L2-S1 vertebrae
10 of 20
Photographs of stomach contents from frogs sampled at the Los Amigos Biological Field Station in the Peruvian Amazon
11 of 20
Data from: Episodic N2O emissions following tillage of a legume-grass cover crop mixture
12 of 20

Space Weather Modeling Framework simulations of ground magnetometer data
13 of 20

Simulated historical (1995-2014) and future (2081-2100) pollen emission using PECM2.0 and Raw data
14 of 20

Wood-warbler (Parulidae) range overlap under climate change scenarios
15 of 20
Bounce-Averaged Quasi-Linear Diffusion Model Simulation Input/Output on Mars’ Crustal Magnetic Field
16 of 20
Simulated pollen emission using PECM and Averaged data
17 of 20
Electromyography from bipolar electrodes implanted into Regenerative Peripheral Nerve Interfaces and residual muscles in persons with amputations
18 of 20
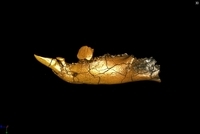
CT Data of UMMP VP 85286, Carpodaptes stonleyi left dentary I/1-2, P/4
19 of 20

VISTA TEC database
20 of 20