Search Constraints
« Previous |
441 - 460 of 1,415
|
Next »
Search Results
Select an image to start the slideshow

Prenatal androgen exposure alters the developmental trajectory of both GnRH neuron and preoptic area RNA transcripts in female mice.
1 of 20

Terrestrial water and energy budget components simulations for the St. Lawrence River Basin
2 of 20
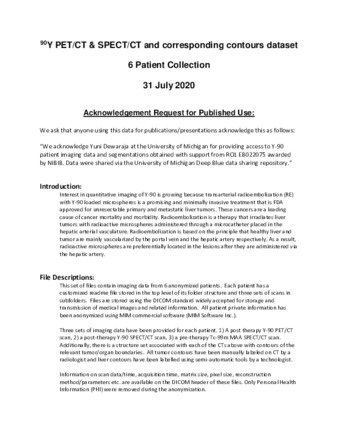
Y-90 PET/CT & SPECT/CT and Corresponding Contours Dataset 31JULY2020
3 of 20
Data for: Global Magnetosphere Response to Solar Wind Dynamic Pressure Pulses during Northward IMF Using the Heliophysics System Observatory
4 of 20

Rotary spectra of surface kinetic energy in drifters and high-resolution global ocean models
5 of 20
UofM pouch cell voltage and expansion dataset and modeling code
6 of 20
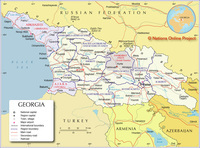
Vani Archaeological Survey Goals and Methods
7 of 20
Dataset (TIRF microscopy movies) for "Direct kinetic fingerprinting and digital counting of single protein molecules"
8 of 20
Hydrologic flushing rates drive nitrogen cycling and plant invasion in a freshwater coastal wetland model and Ecological Applications EAP20-0253 Reproducable Data Archive
9 of 20
High-frequency precipitation variance in high-resolution global coupled ocean-atmosphere models: Precipitation data and analysis code
10 of 20
Dataset from analysis of a peat core from the Tielishahan peatland in the Xinjiang Altai Mountains, northwestern China
11 of 20
AutoSiM software and sample single-molecule trace data accompanying "Automatic classification and segmentation of single-molecule fluorescence time traces with deep learning"
12 of 20
Dataset: Models generated for the bioinformatic analysis of MPER/protein fusions binding to antibody
13 of 20
Data for "Comparison of Anorectal Function Measured using Wearable Digital Manometry and a High Resolution Manometry System." article (PLOS ONE) PONE-D-20-01826R1
14 of 20
A Simple Method for Correcting Empirical Model Densities during Geomagnetic Storms Using Satellite Orbit Data
15 of 20
Long-term Earth-Moon evolution with high-level orbit and ocean tide models
16 of 20
Dataset for analyzing spatial distribution of Y-junctions in flat-mounted retinae
17 of 20
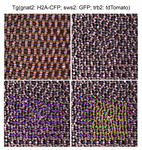
Set of images for Figures 1 and 2 and 6 and Supplementary Figure 7
18 of 20
Dataset for analyzing Y-junction motion in live fish retinae
19 of 20
Dataset for measuring tendency of Y-junctions to line up into grain boundaries during incorporation into retinae
20 of 20