 Access by request
Multivariate Interactive Visualization of Data in Generative Design
| dc.contributor.author | Chaszar, Andre | |
| dc.contributor.author | von Buelow, Peter | |
| dc.contributor.author | Turrin, Michela | |
| dc.date.accessioned | 2016-02-29T20:29:39Z | |
| dc.date.available | 2016-02-29T20:29:39Z | |
| dc.date.issued | 2016-02-29 | |
| dc.identifier.uri | https://hdl.handle.net/2027.42/117408 | |
| dc.description | SimAUD 2016 conference paper with high resolution images and presentation slides | en_US |
| dc.description.abstract | In this paper we describe our work on providing support for design decision making in generative design systems producing large quantities of simulation data. The work is motivated by the continuing challenge of making sense of large design and simulation result datasets. Our approach is to provide methods and tools for multivariate interactive data visualization of the generated designs and simulation results. These enable designers to focus not only on high-performing results but also to examine suboptimal designs’ attributes and outcomes so as to discover relationships giving greater insight to design performance and facilitating guidance of further design generation. We illustrate this with an example exploring building massing and envelope design (fenestration arrangement and external shading) with simulations of daylighting and heat gain. We conclude that the visualization techniques investigated are potentially useful in helping designers to better comprehend the inter-relationships between variable parameters, constraints and outcomes, with consequent benefits in finding good design outcomes as well as in verifying that simulation results are reliable and understanding characteristics of the fitness landscape. | en_US |
| dc.language.iso | en_US | en_US |
| dc.subject | parametric | en_US |
| dc.subject | optimization | en_US |
| dc.subject | performance design | en_US |
| dc.subject | exploration | en_US |
| dc.subject | visualization | en_US |
| dc.subject | multi-objective | en_US |
| dc.subject | multivariate | en_US |
| dc.subject | evolutionary computing | en_US |
| dc.title | Multivariate Interactive Visualization of Data in Generative Design | en_US |
| dc.type | Article | en_US |
| dc.type | Image | en_US |
| dc.type | Presentation | en_US |
| dc.subject.hlbsecondlevel | Architecture | |
| dc.subject.hlbsecondlevel | Urban and Regional Planning | |
| dc.subject.hlbtoplevel | Arts | |
| dc.description.peerreviewed | Peer Reviewed | en_US |
| dc.contributor.affiliationum | Taubman College of Architecture and Urban Planning | en_US |
| dc.contributor.affiliationother | Singapore Univ. of Technolog | en_US |
| dc.contributor.affiliationother | Delft University of Technology | en_US |
| dc.contributor.affiliationumcampus | Ann Arbor | en_US |
| dc.description.bitstreamurl | http://deepblue.lib.umich.edu/bitstream/2027.42/117408/1/Figure1.jpg | |
| dc.identifier.source | Simulation for Architecture and Urban Design (SimAUD) 2016 | en_US |
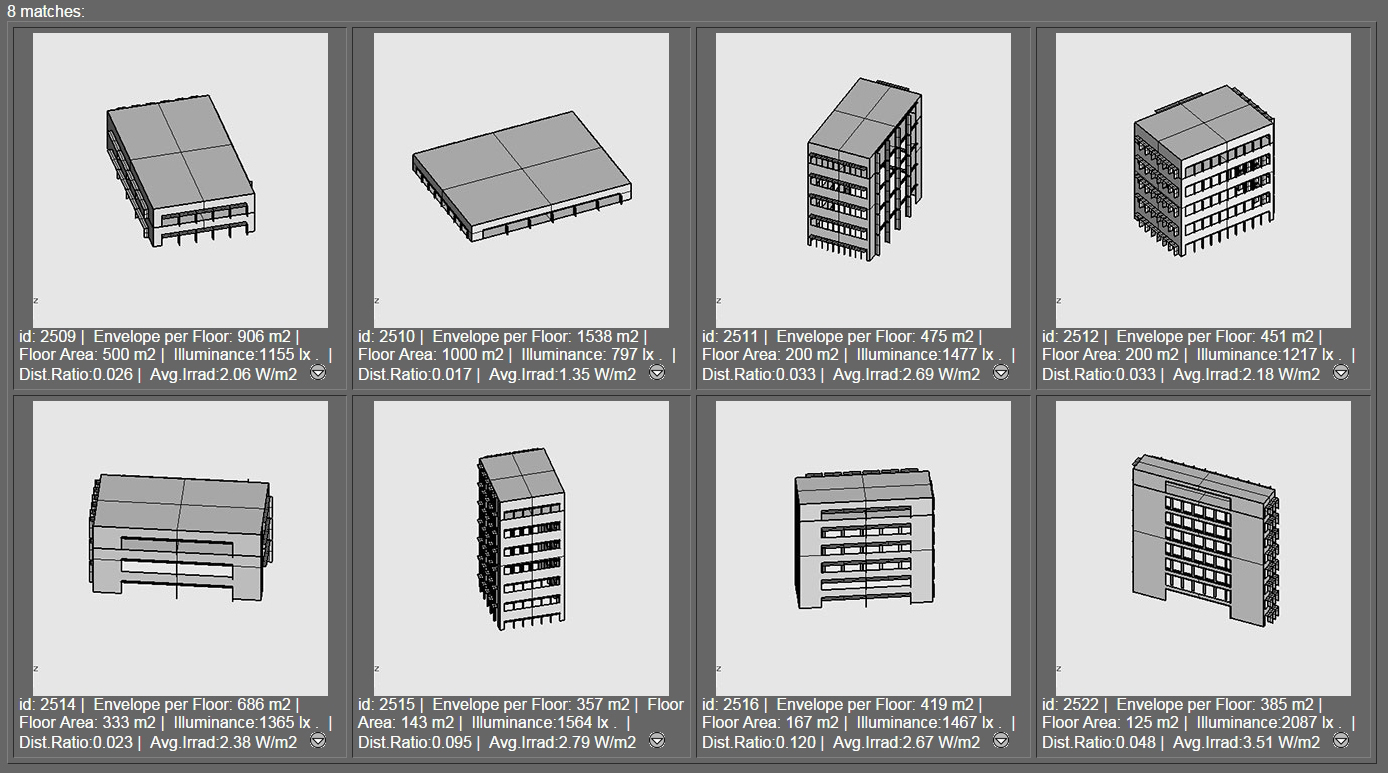
| dc.description.filedescription | Description of Figure1.jpg : Figure 1. Examples of different design solution images. | |
| dc.owningcollname | Architecture and Urban Planning, A. Alfred Taubman College of |
Files in this item
Remediation of Harmful Language
The University of Michigan Library aims to describe library materials in a way that respects the people and communities who create, use, and are represented in our collections. Report harmful or offensive language in catalog records, finding aids, or elsewhere in our collections anonymously through our metadata feedback form. More information at Remediation of Harmful Language.
Accessibility
If you are unable to use this file in its current format, please select the Contact Us link and we can modify it to make it more accessible to you.